 ssssfklsdjfk
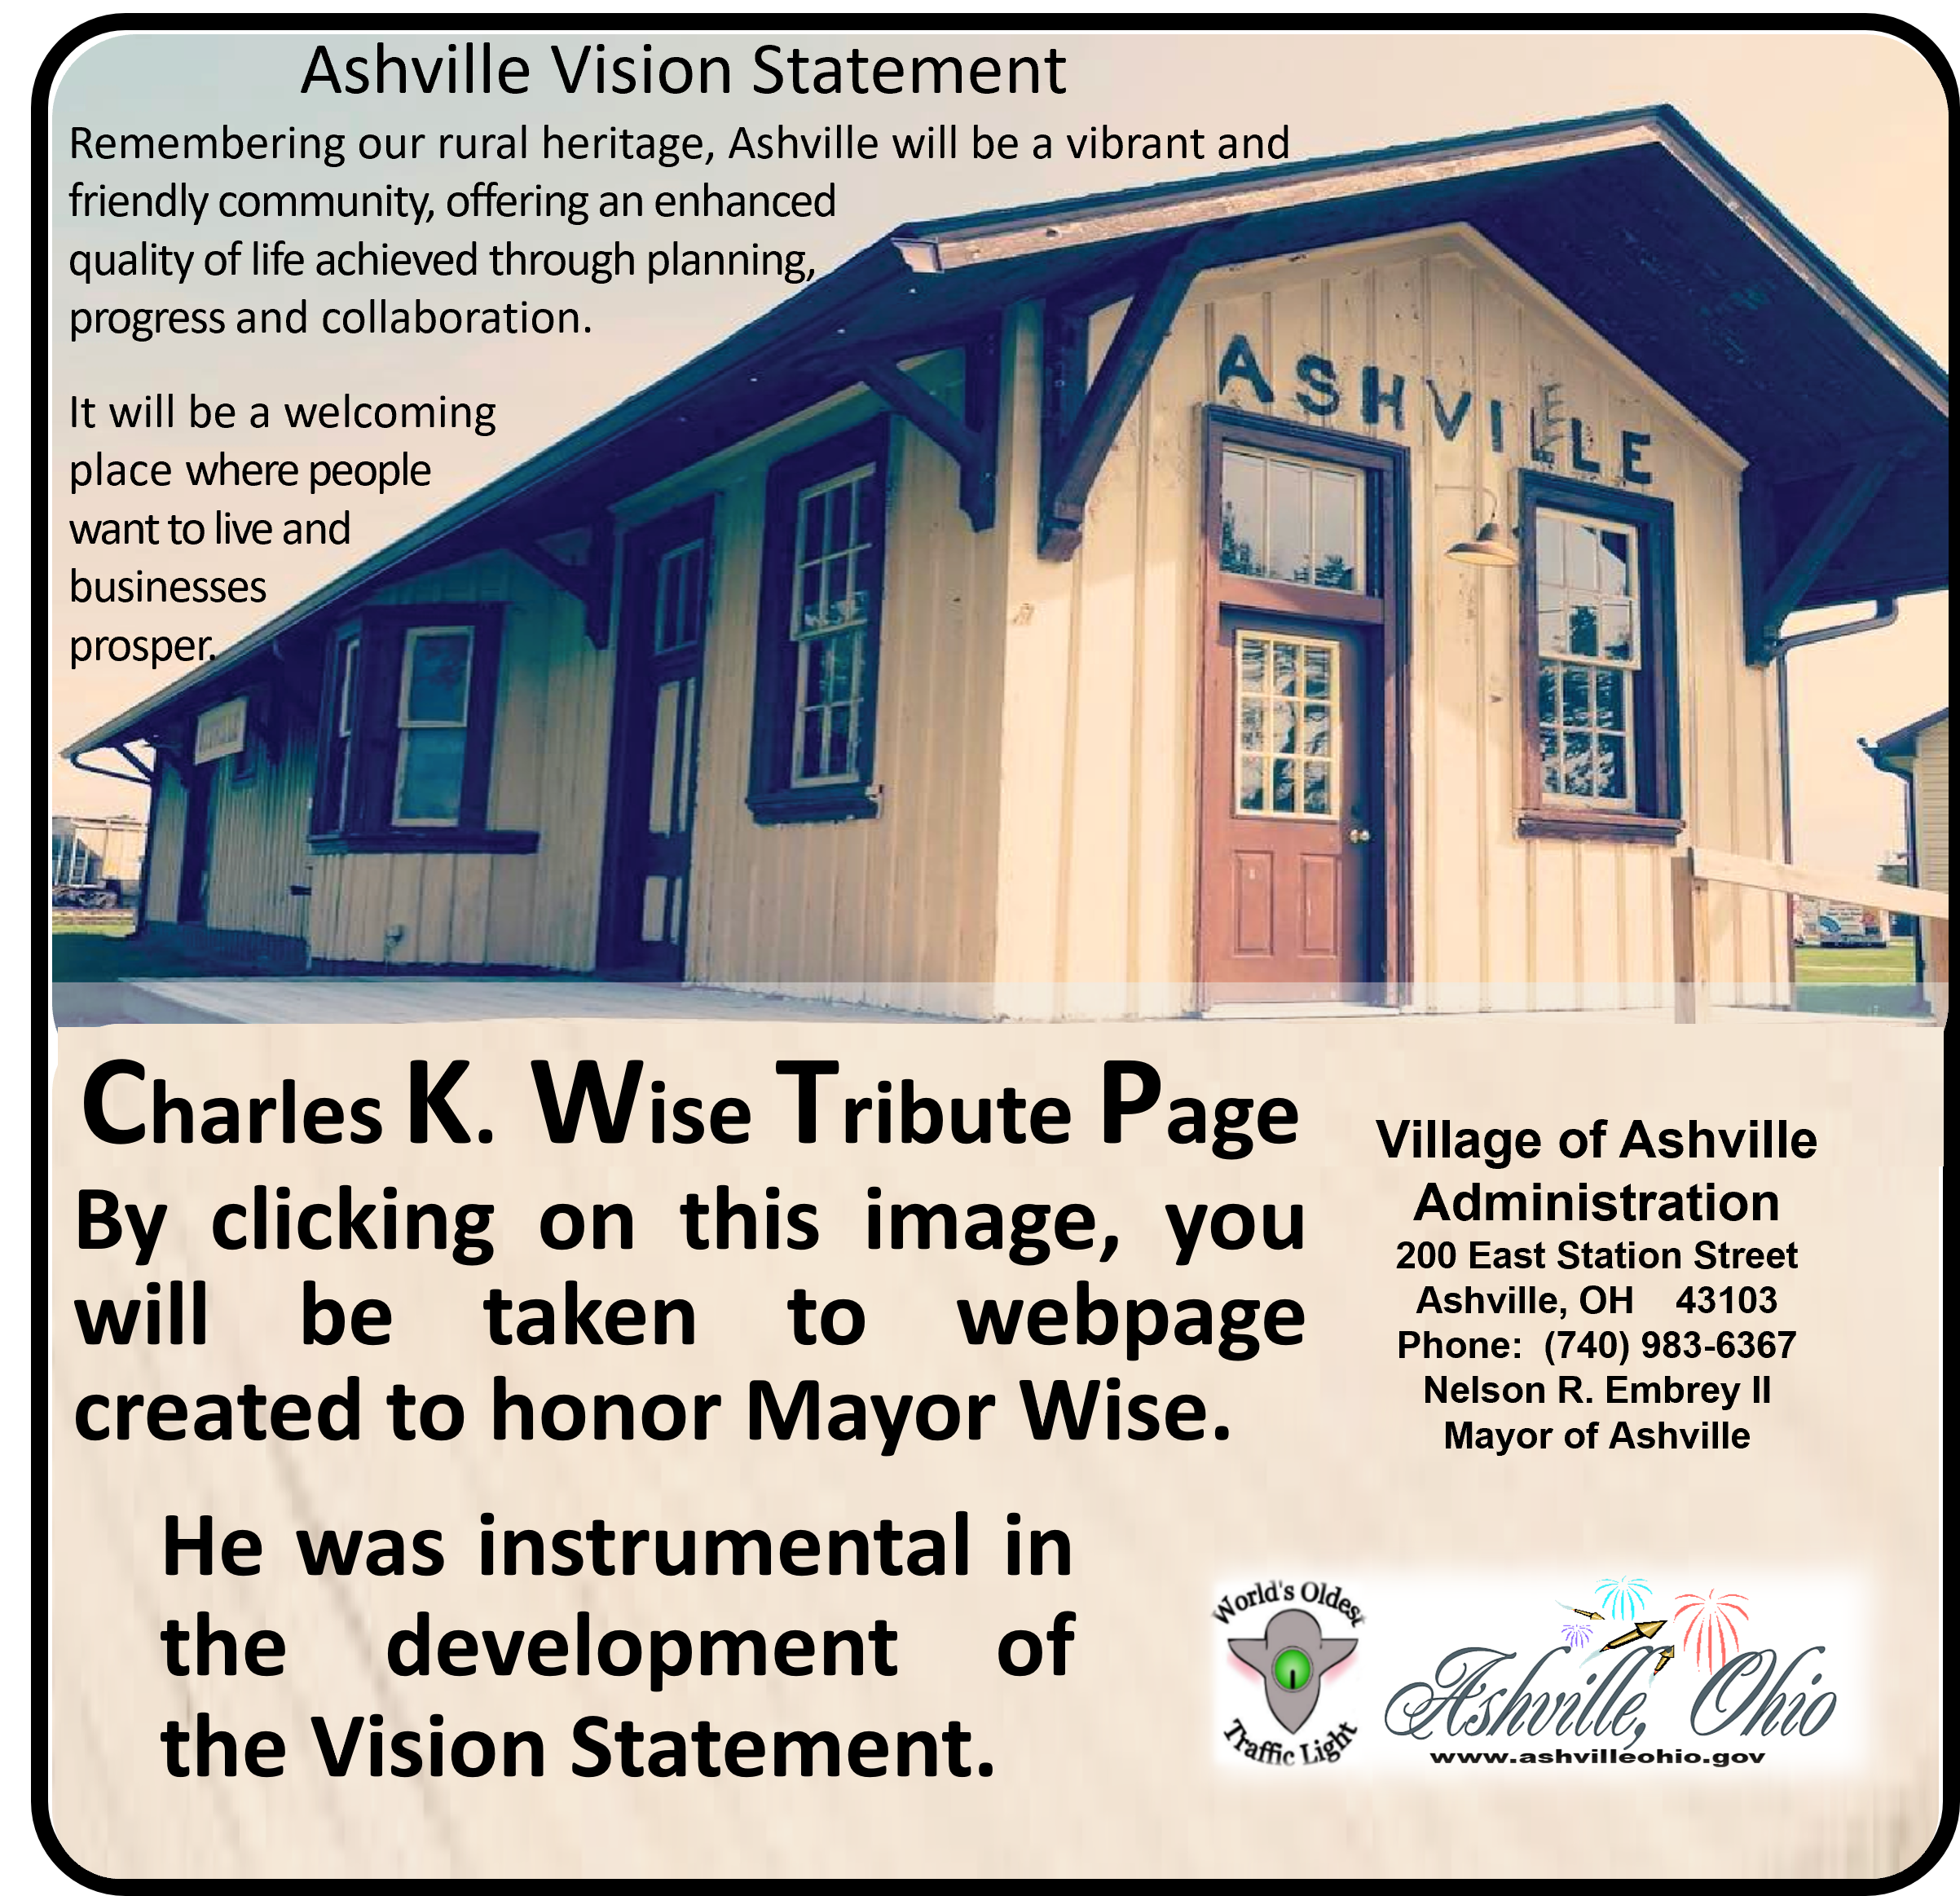


Ohio Environmental Protection Agency
Division of Drinking & Ground Waters
Village of Ashville Water Department
Our Vision Continues
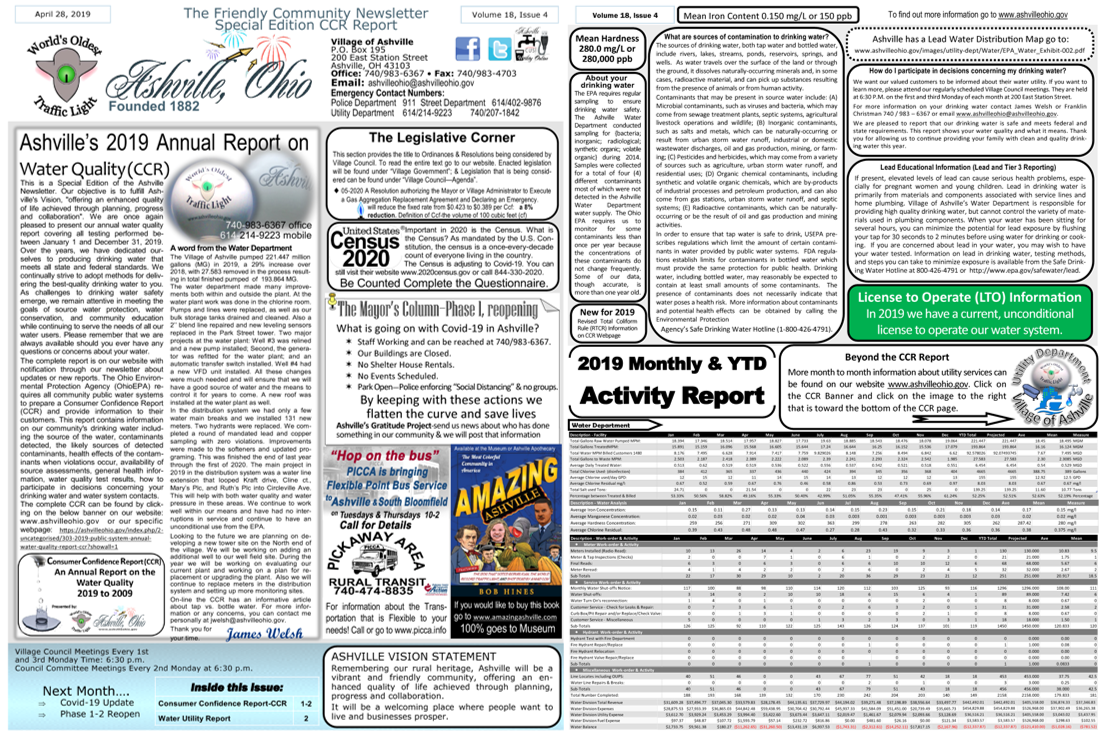
Our objective is to fulfill Ashville's Vision, "offering an enhanced quality of life achieved through planning, progress and collaboration". We are once again pleased to present our annual water quality report covering all testing performed between January 1 and December 31, 2019. Over the years, we have dedicated ourselves to producing drinking water that meets all state and federal standards. We continually strive to adopt methods for delivering the best-quality drinking water to you. As challenges to drinking water safety emerge, we remain attentive in meeting the goals of source water protection, water conservation, and community education while continuing to serve the needs of all our water users. Please remember that we are always available should you ever have any questions or concerns about your water.
The complete 2019 report is on this webpage with notification through our newsletter about updates or new reports. The Ohio Environmental Protection Agency (OhioEPA) requires all community public water systems to prepare a Consumer Confidence Report (CCR) and provide information to their customers. This report contains information on our community's drinking water including the source of the water, contaminants detected, the likely sources of detected contaminants, health effects of the contaminants when violations occur, availability of source assessments, general health information, water quality test results, how to participate in decisions concerning your drinking water and water system contacts.
CCR's are required by the 1996 amendments to the Safe Drinking Water Act. The Federal Rule (40 CFR 141.151 through 155) was finalized on August 19, 1998. We hope this information will provide you comfort and security. We recognize that water quality is a very important area of operation.
Your drinking water met all Ohio EPA standards.
A word from the Water Department
The Village of Ashville pumped 221.447 million gallons (MG) in 2019 with 27.583 removed in the process resulting in total finished pumped of 193.864 MG. The water department made many improvements both within and outside the plant. At the water plant work was done in the chlorine room. Pumps and lines were replaced, as well as our bulk storage tanks drained and cleaned. Also a 2’’ blend line repaired and new leveling sensors replaced in the Park Street tower. Two major projects at the water plant: Well #3 was relined and a new pump installed; Second, the generator was refitted for the water plant; and an automatic transfer switch installed. Well #4 had a new VFD unit installed. All these changes were much needed and will ensure that we will have a good source of water and the means to control it for years to come. A new roof was installed at the water plant as well.
In the distribution system we had only a few water main breaks and we installed 131 new meters. Two hydrants were replaced. We completed a round of mandated lead and copper sampling with zero violations. Improvements were made to the softeners and updated programing. This was finished the end of last year through the first of 2020. The main project in 2019 in the distribution system was a water line extension that looped Kraft drive, Cline ct., Mary’s Plc, and Ruth’s Plc into Circleville Ave. This will help with both water quality and water pressure in these areas. We continue to work well within our means and have had no interruptions in service and continue to have an unconditional use from the EPA.
Looking to the future we are planning on developing a new tower site on the North end of the village. We will be working on adding an additional well to our well field site. During the year we will be working on evaluating our current plant and working on a plan for replacement or upgrading the plant. Also we will continue to replace meters in the distribution system and setting up more monitoring sites.
On-line the CCR has an informative article about tap vs. bottle water. For more information or any concerns, you can contact me personally at This email address is being protected from spambots. You need JavaScript enabled to view it..
Thank you for your time.

Introduction
The Ashville Water Department is pleased to provide you with this year’s Consumer Confidence Report. We want to keep you informed about the excellent water and services we have delivered to you over the past year. Our goal is, and has been to provide you a safe and dependable supply of drinking water. The treatment facility is located at 140 Park Street. The water treatment facility removes iron and manganese by oxidation and filtration. The filtered water is softened using an ion-exchange process. The softened water is disinfected with chlorine prior to distribution to our customer. The Village of Ashville’s Water Department has prepared the following report to provide information to you, the consumer, on the quality of our drinking water. Included in this report is general health information, water quality test results, how to participate in decisions concerning your drinking water and water system contacts.
We have been fortunate to have very few interruptions over the last year in our distribution system, such as large breaks resulting in loss of service. Last year we also installed a new chlorine feed system and overhauled our storage room. New tanks, ventilation, and piping were installed with an outside bulk feed line. These improvements make the delivery of chlorine significantly safer and more convenient.
If you have any questions, do not hesitate to contact the water department.
Thank you for your time.
Source Water and Vulnerability Assessment Information
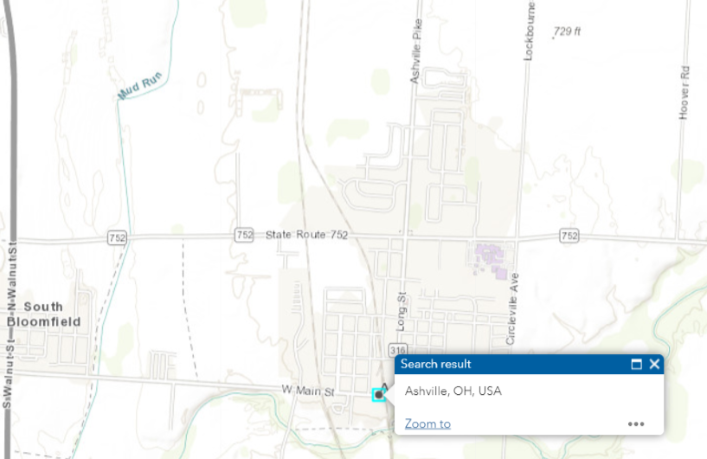
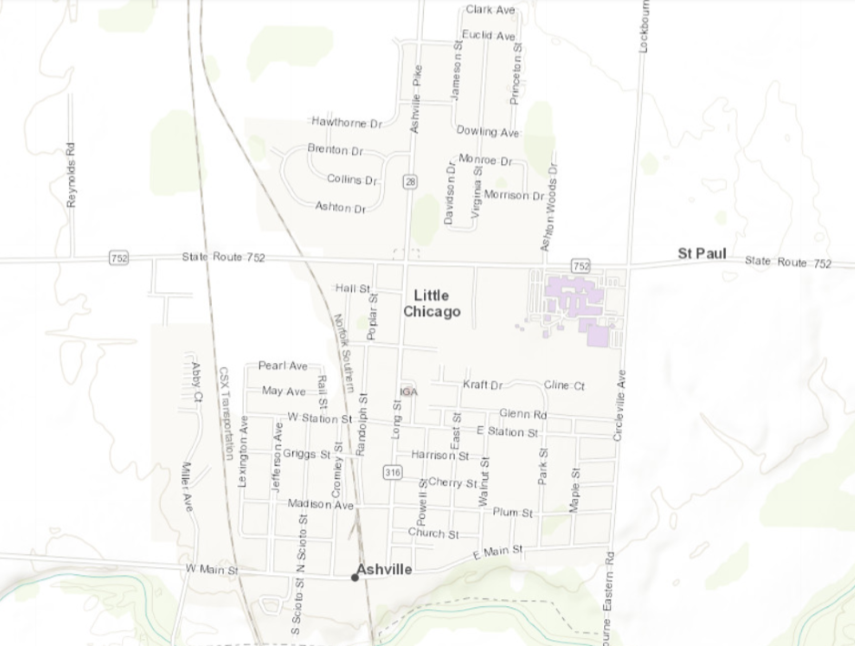
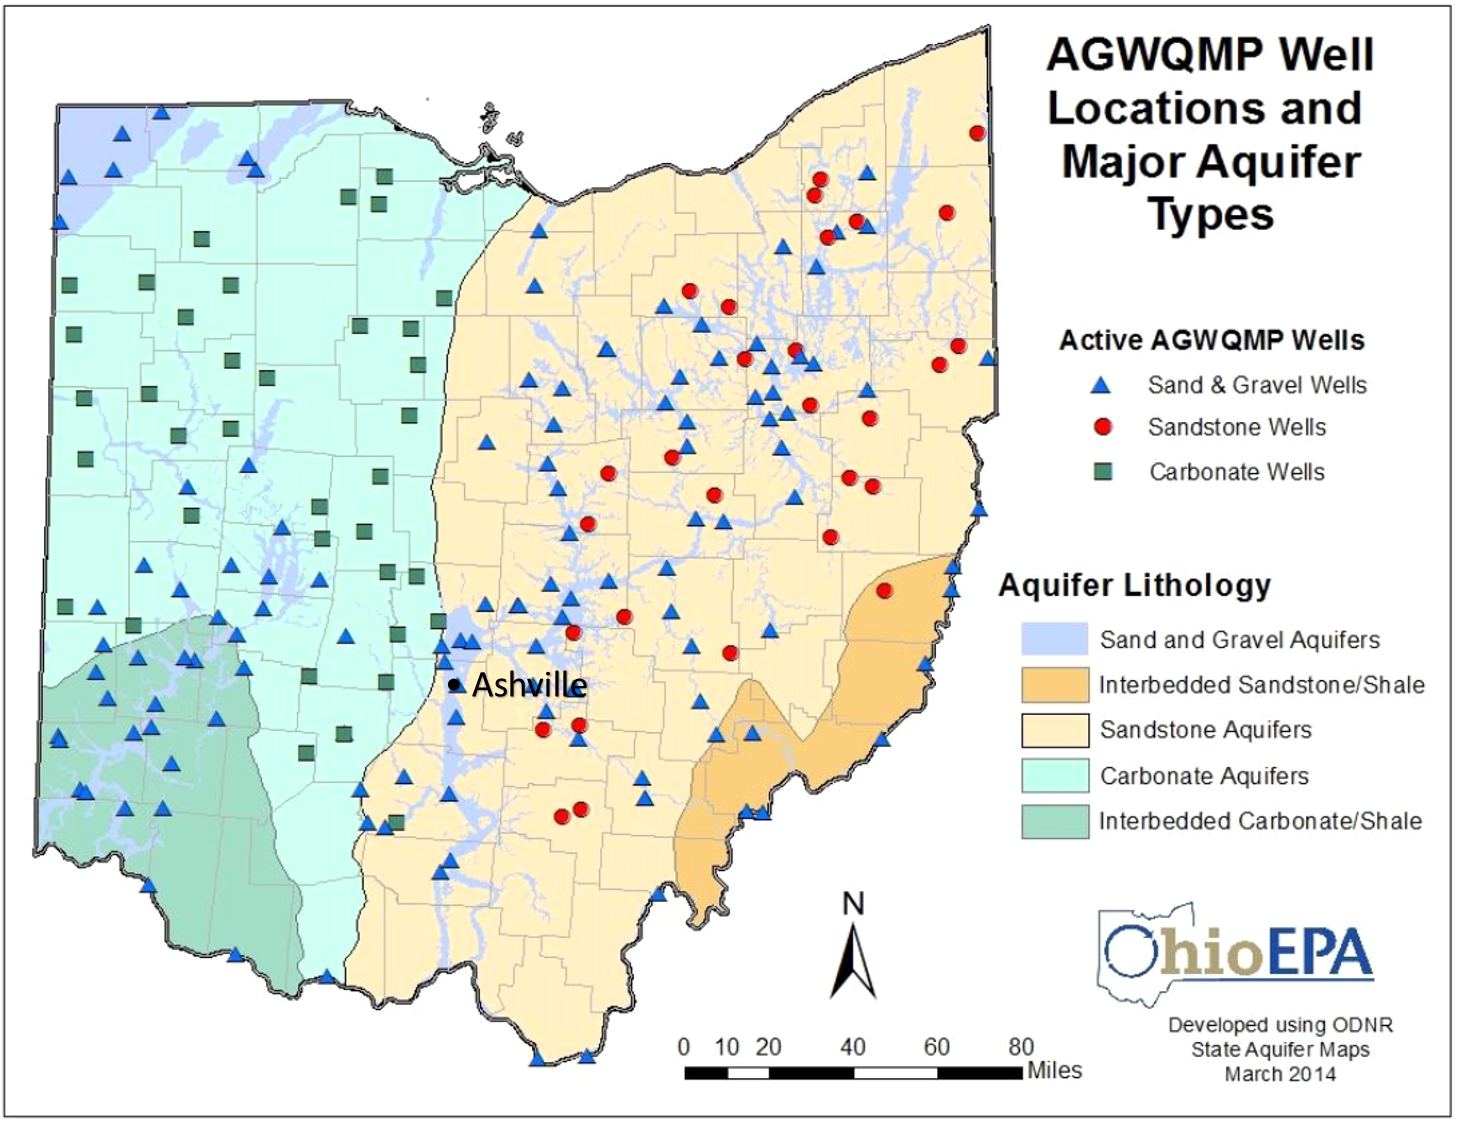
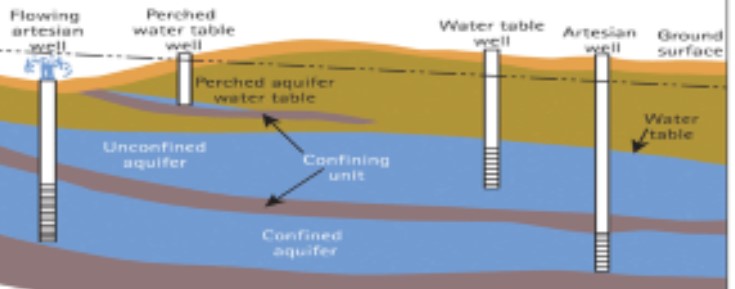
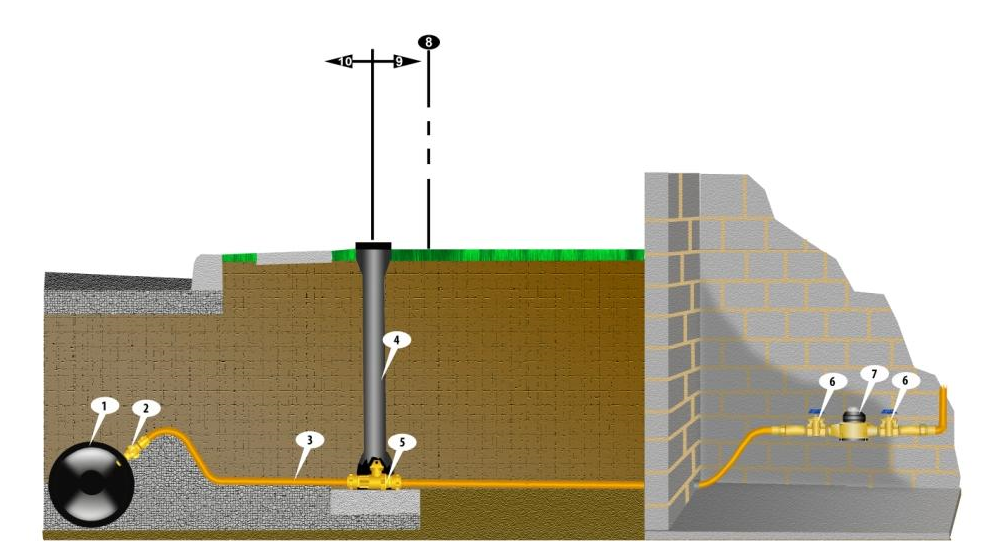
The Village of Ashville’s Water Department receives its drinking water from two (2) wells located at the village-owned and operated facility. A third (3rd) well is located south of the village on Viking Way. These wells obtain raw water from the Teays Valley Aquifer. Aquifers are porous underground formations (such as sand or gravel) that are saturated with water. There are links and information about the Teays Valley Aquifer below. There is also information about the Source Water Assessment and Protection (SWAP). The last item in this section involves graphic display of Water Mains, Water Laterals, Water Taps, Meters, Valves, and Connection Points.
The Ohio Environmental Protection Agency has developed a program called Ohio's Source Water Assessment and Protection (SWAP) which is designed to protect our sources of drinking water. Through this program, the Ohio EPA has endorsed “the Delineation and Potential Contaminant Source Inventory components of the Village of Ashville’s drinking water source protection plan as meeting the requirements of the Ohio Wellhead Protection and Source Water Assessment and Protection Programs”. According to this study, the aquifer (water-rich zone) that supplies water to the Village of Ashville has a high susceptibility to contamination. This determination is based on the following:
- presence of a relatively thin protective layer of clay/shale/other overlying the aquifer,
- shallow depth (less than 50 feet below ground surface) of the uppermost aquifer, and
- presence of significant potential contaminant sources in the protection area.
This susceptibility means that under currently existing conditions, the likelihood of the aquifer becoming contaminated is relatively high. This likelihood can be minimized by implementing appropriate protective measures. More specifically this report identified seven (7) potential significant sources of contamination within the one-year capture zones. They include: (1)sanitary sewer lines, (2,3,4) source wells, (5)natural gas line, (6) Ashville Park, and (7) municipal road maintenance.
The Ohio EPA’s website on Source Water Assessment information is at http://epa.ohio.gov/ddagw/swap.aspx. Another source of more specific information is available by calling James Welsh(email This email address is being protected from spambots. You need JavaScript enabled to view it.) or Franklin Christman (This email address is being protected from spambots. You need JavaScript enabled to view it.) at (740) 983-6367.
More information about the source water assessment or what consumers can do to help protect the aquifer is available by calling Jim Welsh or Franklin Christman at 740-983-6367. The SWAP can be found at http://wwwapp.epa.ohio.gov/gis/swpa/OH6500012.pdf
 |
 |
|
|
Links to information about Ohio Aquifers. Click on the above image or the below addresses. http://epa.ohio.gov/Portals/28/documents/gwqcp/Aquifer&Geochem_ts.pdf https://geosurvey.ohiodnr.gov/portals/geosurvey/PDFs/GeoFacts/gef10.pdf |
The Teays River network, which existed prior to disruption by glaciers during the Last Ice Age. Reconstruction is based on the discovery of large buried valleys in West Virginia, Ohio and Indiana and other evidence. |
|
|
|
| 1. Water Main 2. Water Tap 3. Water Laterial 4 & 5. Curb Shut Off Valve 6, 7 & 8. Meter Set-up | |
Special Precaution Needs
Some people may be more vulnerable to contaminants in drinking water than the general population. Immuno-compromised persons such as persons with cancer undergoing chemotherapy, persons who have undergone organ transplants, people with HIV/AIDS or other immune system disorders, some elderly, and infants can be particularly at risk from infection. These people should seek advice about drinking water from their health care providers. EPA/CDC guidelines on appropriate means to lessen the risk of infection by Cryptosporidium and other microbial contaminants are available from the Safe Drinking Water Hotline (1-800-426-4791).
What are sources of contamination to drinking water?
The sources of drinking water, both tap water, and bottled water, include rivers, lakes, streams, ponds, reservoirs, springs, and wells. As water travels over the surface of the land or through the ground, it dissolves naturally-occurring minerals and, in some cases, radioactive material, and can pick up substances resulting from the presence of animals or from human activity.
Contaminants that may be present in source water include: (A) Microbial contaminants, such as viruses and bacteria, which may come from sewage treatment plants, septic systems, agricultural livestock operations and wildlife; (B) Inorganic contaminants, such as salts and metals, which can be naturally-occurring or result from urban stormwater runoff, industrial or domestic wastewater discharges, oil and gas production, mining, or farming; (C) Pesticides and herbicides, which may come from a variety of sources such as agriculture, urban stormwater runoff, and residential uses; (D) Organic chemical contaminants, including synthetic and volatile organic chemicals, which are by-products of industrial processes and petroleum production, and can also come from gas stations, urban storm water runoff, and septic systems; (E) Radioactive contaminants, which can be naturally-occurring or be the result of oil and gas production and mining activities.
In order to ensure that tap water is safe to drink,
USEPA prescribes regulations which limit the number of certain contaminants in water provided by public water systems. FDA regulations establish limits for contaminants in bottled water which must provide the same protection for public health. Drinking water, including bottled water, may reasonably be expected to contain at least small amounts of some contaminants. The presence of contaminants does not necessarily indicate that water poses a health risk. More information about contaminants and potential health effects can be obtained by calling the Environmental Protection Agency's Safe Drinking Water Hotline (1-800-426-4791).
Lead Educational Information and Tier 3 Reporting
If present, elevated levels of lead can cause serious health problems, especially for pregnant women and young children. Lead in drinking water is primarily from materials and components associated with service lines and home plumbing. The village of Ashville’s Water Department is responsible for providing high-quality drinking water, but cannot control the variety of materials used in plumbing components. When your water has been sitting for several hours, you can minimize the potential for lead exposure by flushing your tap for 30 seconds to 2 minutes before using water for drinking or cooking. If you are concerned about lead in your water, you may wish to have your water tested. Information on lead in drinking water, testing methods, and steps you can take to minimize exposure is available from the Safe Drinking Water Hotline at 800-426-4791 or at http://www.epa.gov/safewater/lead.
Revised Total Coliform Rule (RTCR) Information
All water systems were required to begin compliance with a new rule, the Revised Total Coliform Rule, on April 1, 2016. The new rule maintains the purpose to protect public health by ensuring the integrity of the drinking water distribution system and monitoring for the presence of total coliform bacteria, which includes E. coli bacteria. The U.S. EPA anticipates greater public health protection under the new rule, as it requires water systems that are vulnerable to microbial contamination to identify and fix problems. As a result, under the new rule there is no longer a maximum contaminant level violation for multiple total coliform detections. Instead, the new rule requires water systems that exceed a specified frequency of total coliform occurrences to conduct an assessment to determine if any significant deficiencies exist. If found, these must be corrected by the PWS. No deficiencies exist with this public water system.
2019 Water Quality Data
Our water is monitored for many different kinds of substances on a sampling schedule. The water we deliver must meet specific health standards. Here we show only those substances that were detected in our water. All are below maximum contaminant levels allowed. Not listed are many others we test for, but that were not detected. Unless otherwise noted, all parameters were tested in 2019. Remember that detecting a substance does not mean the water is unsafe to drink; our goal is to keep all detects below their respective maximum allowed levels. Some that were tested once because the concentrations of these substances do not change frequently. In these cases, the most recent sample data are included, along with the year in which the sample was taken.
Contaminants are divided into two lists. One list of contaminants are the reportable group that has levels that require being on the CCR Report. The second list involves those that were tested but did not reach the required reportable group. They are listed to provide you added information.
Listed below is information on those contaminants that were found in the Village of Ashville’s Water Department:
|
REGULATED SUBSTANCES |
||||||||
|
SUBSTANCE (UNIT OF MEASURE) |
YEAR SAMPLED |
MCL [MRDL] |
MCLG [MRDLG] |
AMOUNT DETECTED |
RANGE LOW-HIGH |
VIOLATION |
TYPICAL SOURCE |
HEALTH EFFECTS |
|
DISINFECTANTS |
||||||||
|
Chlorine (ppm) |
2018 |
MRDL=4 |
MRDLG=4 |
0.0352 |
0.17-5.55 |
No |
Water additive used to control microbes |
Some people who use water containing chlorine well in excess of the MRDL could experience irritating effects to their eyes and nose. Some people who drink water containing chlorine well in excess of the MRDL could experience stomach discomfort. |
|
INORGANIC CONTAMINANTS |
||||||||
|
Barium (ppm) |
2019 |
2 |
2 |
0.101 |
One Sample |
No |
Discharge of drilling wastes; Discharge from metal refineries; Erosion of natural deposits |
Some people who drink water containing barium in excess of the MCL over many years could experience an increase in their blood pressure. |
|
Cyanide (ppb) |
2019 |
200 | 200 |
14 |
One Sample |
No |
Discharge from steel/metal factories; Discharge from plastic and fertilizer factories |
Some people who drink water containing cyanide well in excess of the MCL over many years could experience nerve damage or problems with their thyroid. |
|
Tap water samples were collected for lead and copper analyses from sample sites throughout the community. |
||||||||
|
SUBSTANCE (UNIT OF MEASURE) |
YEAR SAMPLED |
AL |
MCLG |
AMOUNT DETECTED (90th %ILE |
SITES ABOVE AL/TOTAL SITES |
VIOLATION |
TYPICAL SOURCE |
HEALTH EFFECTS |
|
Copper (ppm) |
2019 |
1.3 |
1.3 |
0.121 |
0/48 |
No |
Corrosion of household plumbing systems, Erosion of natural deposits |
Copper is an essential nutrient, but some people who drink water containing copper in excess of the action level over a relatively short amount of time could experience gastrointestinal distress. Some people who drink water containing copper in excess of the action level over many years could suffer liver or kidney damage. People with Wilson’s Disease should consult their personal doctor. |
|
Lead (ppb) |
2019 |
15 |
0 |
0.0 |
0/48 |
No |
Corrosion of household plumbing systems, Erosion of natural deposits |
Infants and children who drink water containing lead in excess of the action level could experience delays in their physical or mental development. Children could show slight deficits in attention span and learning abilities. Adults who drink this water over many years could develop kidney problems or high blood pressure. |
|
Tap water samples were collected for lead and copper analyses from sample sites throughout the community. |
|||||||
|
SUBSTANCE (UNIT OF MEASURE) |
YEAR SAMPLED |
AL |
MCLG |
AMOUNT DETECTED (90th %ILE |
SITES ABOVE AL /TOTAL SITES |
VIOLATION |
TYPICAL SOURCE |
|
Copper (ppm) |
2019 |
1.3 |
1.3 |
.138 |
0/48 |
No |
Corrosion of household plumbing systems, Erosion of natural deposits |
|
Lead (ppb) |
2019 |
15 |
0 |
.007 |
0/48 |
No |
Corrosion of household plumbing systems, Erosion of natural deposits |
The limits detected are below the reportable limit requirement.
|
REGULATED SUBSTANCES |
||||||||
|
SUBSTANCE (UNIT OF MEASURE) |
YEAR SAMPLED |
MCL [MRDL] |
MCLG [MRDLG] |
AMOUNT DETECTED |
RANGE LOW-HIGH |
VIOLATION |
TYPICAL SOURCE |
HEALTH EFFECTS |
|
INORGANIC CONTAMINANTS |
||||||||
|
Antimony (ppb) |
2019 |
6 |
6 |
< 4.0 |
One Sample |
No |
Discharge from petroleum refineries; fire retardants; ceramics; electronics; solder |
Some people who drink water containing antimony well in excess of the MCL over many years could experience increases in blood cholesterol and decreases in blood sugar. |
|
Arsenic (ppb) |
2019 |
10 |
NA |
< 3.0 |
One Sample |
No |
Erosion of natural deposits; Runoff from orchards; Runoff from glass and electronics production wastes |
Some people who drink water containing arsenic in excess of the MCL over many years could experience skin damage or problems with their circulatory system, and may have an increased risk of getting cancer. |
|
Beryllium (ppb) |
2019 |
4 |
4 |
< 1.0 |
One Sample |
No |
Discharge from metal refineries and coal-burning factories; Discharge from electrical, aerospace, and defense industries |
Some people who drink water containing beryllium well in excess of the MCL over many years could develop intestinal lesions. |
|
Cadmium (ppb) |
2019 |
5 |
5 |
< 1.0 |
One Sample |
No |
Corrosion of galvanized pipes; Erosion of natural deposits; Discharge from metal refineries; Runoff from waste batteries and paints |
Some people who drink water containing cadmium in excess of the MCL over many years could experience kidney damage. |
|
Chromium (ppb) |
2019 |
100 |
100 |
<5.0 |
One Sample |
No |
Discharge from steel and pulp mills; Erosion of natural deposits |
Some people who use water containing chromium well in excess of the MCL over many years could experience allergic dermatitis. |
| Fluoride (ppm) | 2019 | 4 | 4 | 0.91 | One Sample | No | Erosion of natural deposits; Water additive which promotes strong teeth; Discharge from fertilizer and aluminum factories | Some people who drink water containing fluoride in excess of the MCL over many years could get bone disease, including pain and tenderness of the bones. Fluoride in drinking water at half the MCL or more may cause mottling of children’s teeth, usually in children less than nine years old. Mottling also known as dental fluorosis, may include brown staining and/or pitting of the teeth, and occurs only in developing teeth before they erupt from the gums. |
|
Mercury [inorganic] (ppb) |
2019 |
2 |
2 |
< 0.5 |
One Sample |
No |
Erosion of natural deposits; Discharge from refineries and factories; Runoff from landfills; Runoff from cropland |
Some people who drink water containing inorganic mercury well in excess of the MCL over many years could experience kidney damage. |
|
Nickel (ppb) |
2019 |
NA |
NE |
< 10.0 |
One Sample |
No |
Corrosion of bronze. |
|
|
Nitrate-Nitrate (ppm) |
2019 |
10 |
10 |
< 0.0005 |
One Sample |
No |
Runoff from fertilizer use; Leaching from septic tanks, sewage; Erosion of natural deposits |
Infants below the age of six months who drink water containing nitrate in excess of the MCL could become seriously ill and, if untreated, may die. Symptoms include shortness of breath and blue baby syndrome. |
|
Nitrate as Ni-NI (ppm) |
2019 |
1 |
1 |
< 0.0005 |
One Sample |
No |
Runoff from fertilizer use; Leaching from septic tanks, sewage; Erosion of natural deposits |
Infants below the age of six months who drink water containing nitrite in excess of the MCL could become seriously ill and, if untreated, may die. Symptoms include shortness of breath and blue baby syndrome. |
|
Selenium (ppb) |
2019 |
50 |
50 |
< 5.0 |
One Sample |
No |
Discharge from petroleum and metal refineries; Erosion of natural deposits; Discharge from mines |
Selenium is an essential nutrient. However, some people who drink water containing selenium in excess of the MCL over many years could experience hair or fingernail losses, numbness in fingers or toes, or problems with their circulation. |
|
Thallium (ppb) |
2019 |
2 |
0.5 |
< 1.5 |
2 |
No |
Leaching from ore-processing sites; Discharge from electronics, glass, and drug factories |
Some people who drink water containing thallium in excess of the MCL over many years could experience hair loss, changes in their blood, or problems with their kidneys, intestines, or liver. |
2019 Expanded List of Water Quality Information
About your drinking water:
The EPA requires regular sampling to ensure drinking water safety. The Ashville Water Department conducted sampling for {bacteria; inorganic; radiological; synthetic organic; volatile organic} during 2014. Samples were collected for a total of four (4) different contaminants most of which were not detected in the Ashville Water Department water supply. The Ohio EPA requires us to monitor for some contaminants less than once per year because the concentrations of these contaminants do not change frequently. Some of our data, though accurate, are more than one year old.
|
License to Operate (LTO) Information In 2019 ,we have a current unconditional license to operate our water system.
|
Bottled Water vs. Tap Water – Facts & 4 Reasons to Drink Tap
The Rise of Bottled Water
Bottled water has grown more and more popular over the last few decades. The IBWA estimates that in 1976, each American drank 1.6 gallons of bottled water. By 2014, they were drinking more than 21 times as much. Today, more than one out of every six bottled drinks sold in this country is a bottle of water, making bottled water nearly as popular as carbonated soft drinks.
The IBWA attributes the growing popularity of bottled water to health-consciousness. A 16-ounce bottle of Coca-Cola has 190 calories and 52 grams of sugar, while a 16-ounce bottle of water has no calories, no sugar, and no artificial sweeteners. However, that doesn’t explain why consumers are choosing bottled water over tap water, which is also sugar-free and calorie-free.
Taste
One of the most common reasons people give for drinking bottled water is that it tastes better than their local tap water. For instance, in a blind taste test at the offices of Buzzfeed, staffers universally agreed that all the bottled waters they tried were better than the sample of unfiltered Los Angeles tap water, which tasters described as “pool water” and “disgusting.”
However, this result is actually the exception rather than the norm. In most blind taste tests, tap water easily holds its own against bottled waters, even the pricey ones. You can see the same result in numerous cities, both in the U.S. and abroad:
Safety
Many people choose bottled water because of concerns about the safety of their tap water. In many cases, these fears are perfectly reasonable.
Environmental writer Elizabeth Royte, author of the new book, “Bottlemania: How Water Went on Sale and Why We Bought It,” points out in an interview with NPR that more than 10% of the community water systems in the U.S. don’t meet the standards set by the Safe Drinking Water Act. Also, about 10% of all Americans get their water from private wells, which aren’t covered under the SDWA. That means about 60 million Americans are getting tap water that may or may not be safe to drink.
However, choosing bottled water isn’t really a solution. According to the EPA, the standards for bottled water in the U.S. are exactly the same as those for tap water – and bottled water isn’t subject to the same reporting standards as tap water. Under the SDWA, municipal water systems must send users a consumer confidence report once per year telling them where their water comes from and whether it meets federal standards.
Bottled water, by contrast, is considered a food product and regulated by the Food and Drug Administration (FDA). Under FDA rules, bottled water doesn’t usually have to state what source it comes from or what methods were used to treat it. A 2009 investigation by the U.S. Government Accountability Office found that only “a small percentage” of all bottled water companies give their customers access to the same information about their water that municipal water suppliers are required to provide.
The FDA monitors and inspects water bottling plants, but it considers this job a “low priority” and doesn’t do it on any kind of regular schedule. Moreover, if a bottler fails to meet federal safety standards, it can still sell the water. All it has to do is put a statement on the label, such as “contains excessive bacteria” or “excessively radioactive.” In 1999, the National Resources Defense Council, an environmental group, tested 1,000 bottles of water from 103 different brands and found that for about one-third of them, at least one sample was over the allowable limits for synthetic organic chemicals, bacteria, or arsenic.
Germs are particularly likely to cause problems in bottled water. As the World Health Organization explains in its 2008 Guidelines for Drinking-Water Quality, “Some microorganisms that are normally of little or no public health significance may grow to higher levels in bottled water.” Food Safety News reports that in June 2015, 14 different brands of bottled water had to be recalled because of possible contamination with E. coli bacteria.
Fortunately, no one was sickened by this water, but problems with bottled water aren’t always caught in time. The Centers for Disease Control and Prevention lists 14 outbreaks of acute gastrointestinal illness caused by bottled water between 1973 and 2010.
Sustainability
When it comes to taste and safety, bottled water isn’t necessarily worse than tap water – it just isn’t better. However, when it comes to its environmental impact, tap water is definitely far greener.
The environmental costs of bottled water include the following:
- Water Scarcity. Fiji Water isn’t the only brand that comes from a place where water resources are limited. Many American brands get their water from drought-ridden California. Arrowhead and Crystal Geyser tap natural springs in the California mountains, while Aquafina and Dasani draw on the municipal water supply in California cities, according to an investigation by The Desert Sun. In fact, The Desert Sun reports that Nestle Waters North America gets its Arrowhead water from a spring in the San Bernadino National Forest using a permit that officially expired in 1988. To add insult to injury, the companies use still more water in the manufacturing process. A representative of the Coca-Cola company admitted to Mother Jones that its plants use 1.63 liters of water for every liter of bottled beverages they produce in California – including Dasani bottled water.
- Toxic Chemicals. Most water bottles are made from a kind of plastic called polyethylene terephthalate, or PET. Manufacturing this type of plastic produces a variety of toxic chemicals into the air, including nickel, ethylbenzene, ethylene oxide, and benzene. According to a report by the Berkeley Plastics Task Force, making a 16-ounce bottle out of PET creates more than 100 times as much air and water pollution as making the bottle out of glass. Worse still, some of the toxic chemicals in the plasticcan leach out over time into the water inside – particularly if the bottle is rinsed and reused.
- Energy Use. Bottled water uses energy at every stage of production: treating the water, manufacturing the bottles, filling them, shipping them, and keeping the water cold. The Pacific Institutecalculated in 2007 that just producing the bottles for the bottled water Americans drink used the equivalent of more than 17 million barrels of oil. A 2009 Pacific Institute report, published in the peer-reviewed journal Environmental Research Letters, concludes that across its entire life cycle, bottled water takes anywhere from 1,100 to 2,000 times as much energy to produce as tap water.
- Greenhouse Gas Emissions. Anything that uses fossil fuels also creates greenhouse gases. The Pacific Institute estimates that the manufacturing of plastic water bottles alone produced more than 2.5 million tons of carbon dioxide in 2006 – not even counting the emissions from shipping the bottles. According to the EPA’s Greenhouse Gas Equivalencies Calculator, that gives water bottles a carbon footprintequal to more than half a million passenger vehicles.
- Packaging Waste. The Pacific Institutecalculates that about 3.8 million tons of PET are used each year to make water bottles – and only about 31% of that PET gets recycled, according to a 2012 EPA fact sheet. The rest ends up in landfills or gets burned (releasing toxic chemicals such as dioxin in the process), or simply gets tossed aside as litter. Many discarded plastic bottles eventually make their way into the oceans, where they can prove deadly to fish, seabirds, and other creatures that swallow them.
Final Word
Water is a necessity of life. In a world where so many people have to trek miles every day to fetch their water from the nearest stream, Americans are very lucky to live in a country where clean, safe water is available at the turn of a tap. It’s just common sense to take advantage of this great privilege, instead of shelling out money for something that comes into our homes practically free.
That’s not to say that drinking bottled water is always a bad idea. For instance, when a flood or a broken pipe interrupts the local water supply, bottled water can be a literal lifesaver. Similarly, if you’re out at a concert or a ball game and you need to buy a drink, choosing a bottle of water instead of a bottle of soda is definitely the right choice for your health. However, when you have a choice between bottled water and tap water, either filtered or unfiltered, drinking from the tap is a better choice for your wallet and for the planet.
Definitions of some terms contained within this report.
- Maximum Contaminant Level Goal (MCLG): The level of a contaminant in drinking water below which there is no known or expected risk to health. MCLGs allow for a margin of safety.
- Maximum Contaminant Level (MCL): The highest level of contaminant that is allowed in drinking water. MCLs are set as close to the MCLGs as feasible using the best available treatment technology.
- Parts per Million (ppm) or Milligrams per Liter (mg/L) are units of measure for concentration of a contaminant. A part per million corresponds to one second in approximately 11.5 days.
- Parts per Billion (ppb) or Micrograms per Liter (μg/L) are units of measure for concentration of a contaminant. A part per billion corresponds to one second in 31.7 years.
- Action Level (AL): The concentration of a contaminant which, if exceeded, triggers treatment or other requirements which a water system must follow.
- Action Level Goal (ALG): The level of contaminant in drinking water below which there is no known or expected risk to health. ALGs allow for a margin of safety.
- Maximum Residual Disinfectant Level Goal (MRDLG): The level of drinking water disinfectant below which there is no known or expected risk to health.
- Maximum Residual Disinfectant Level (MRDL): The highest level of a disinfectant allowed in drinking water.
- Million Fibers per Liter (MFL) millirems per year (mrem/year)pico Curies per liter is a measure of radioactivity = pCi/L.
- The “<“ symbol: A symbol which means less than. A result of <5 means that the lowest level that could be detected was 5 and the contaminant in that sample was not detected.
How do I participate in decisions concerning my drinking water?
We want our valued customers to be informed about their water utility. If you want to learn more, please attend our regularly scheduled Village Council meetings. They are held at 6:30 P.M. on the first and third Monday of each month at 200 East Station Street.
For more information on your drinking water contact James Welsh or Franklin Christman (740) 983–6367.
We are pleased to report that our drinking water is safe and meets federal and state requirements. This report shows your water quality and what it means. Drinking water, including bottled drinking water, may be reasonably expected to contain at least small amounts of some contaminants. The presence of these contaminants does not necessarily indicate that water poses a health risk. Thank you for allowing us to continue providing your family with clean and quality drinking water this year.
New for 2017 - Lead Mapping of Water Distribution System
In 2017 the OhioEPA required municipalities to develop a Lead Water Distribution Map, click below:
Map of Lead for Distribution System
Narrative on the creation of the Map of Lead of Lead for Distribution System
Lead and Copper Monitoring Report
The Village of Ashville also has an Emergency / Back-up connection with the Village of South Bloomfield. During 2019 we used 385,000 gallons from this connection over 365 days. On average, this connection is used for approximately 11 days each year. This report does not contain information on the water quality received from the Village of South Bloomfield, but a copy of their consumer confidence report can be obtained by contacting the South Bloomfield Village Administrator, C. Joe Allen at 740-983/2541.
or
Link to the South Bloomfield Consumer Confidence Report (CCR)
Click on the image below to go to South Bloomfield's CCR

Past Consumer Confidence Reports
|
For more month to month and annual utility department information click on the the image to the right to access the 2018 Water Utility Department Report.
|
|
For the Special Environmental Projects (SEP's) completed in 2014 click on the the image to the right to access that information.
|
|
For the information about the Water Resources Recovery Facility (WRRF) click on the the image to the right to access that information.
|