bajfsdojfsdajfklasdjsssssssssssssssssssssssss                                                ssssssssss      s33ssssfklsdjfkCentral Ohio Air Quality 

For optimum phone homepage use landscape/turn sideways

Browser Menu To access use portrait

  • Vision

    Vision

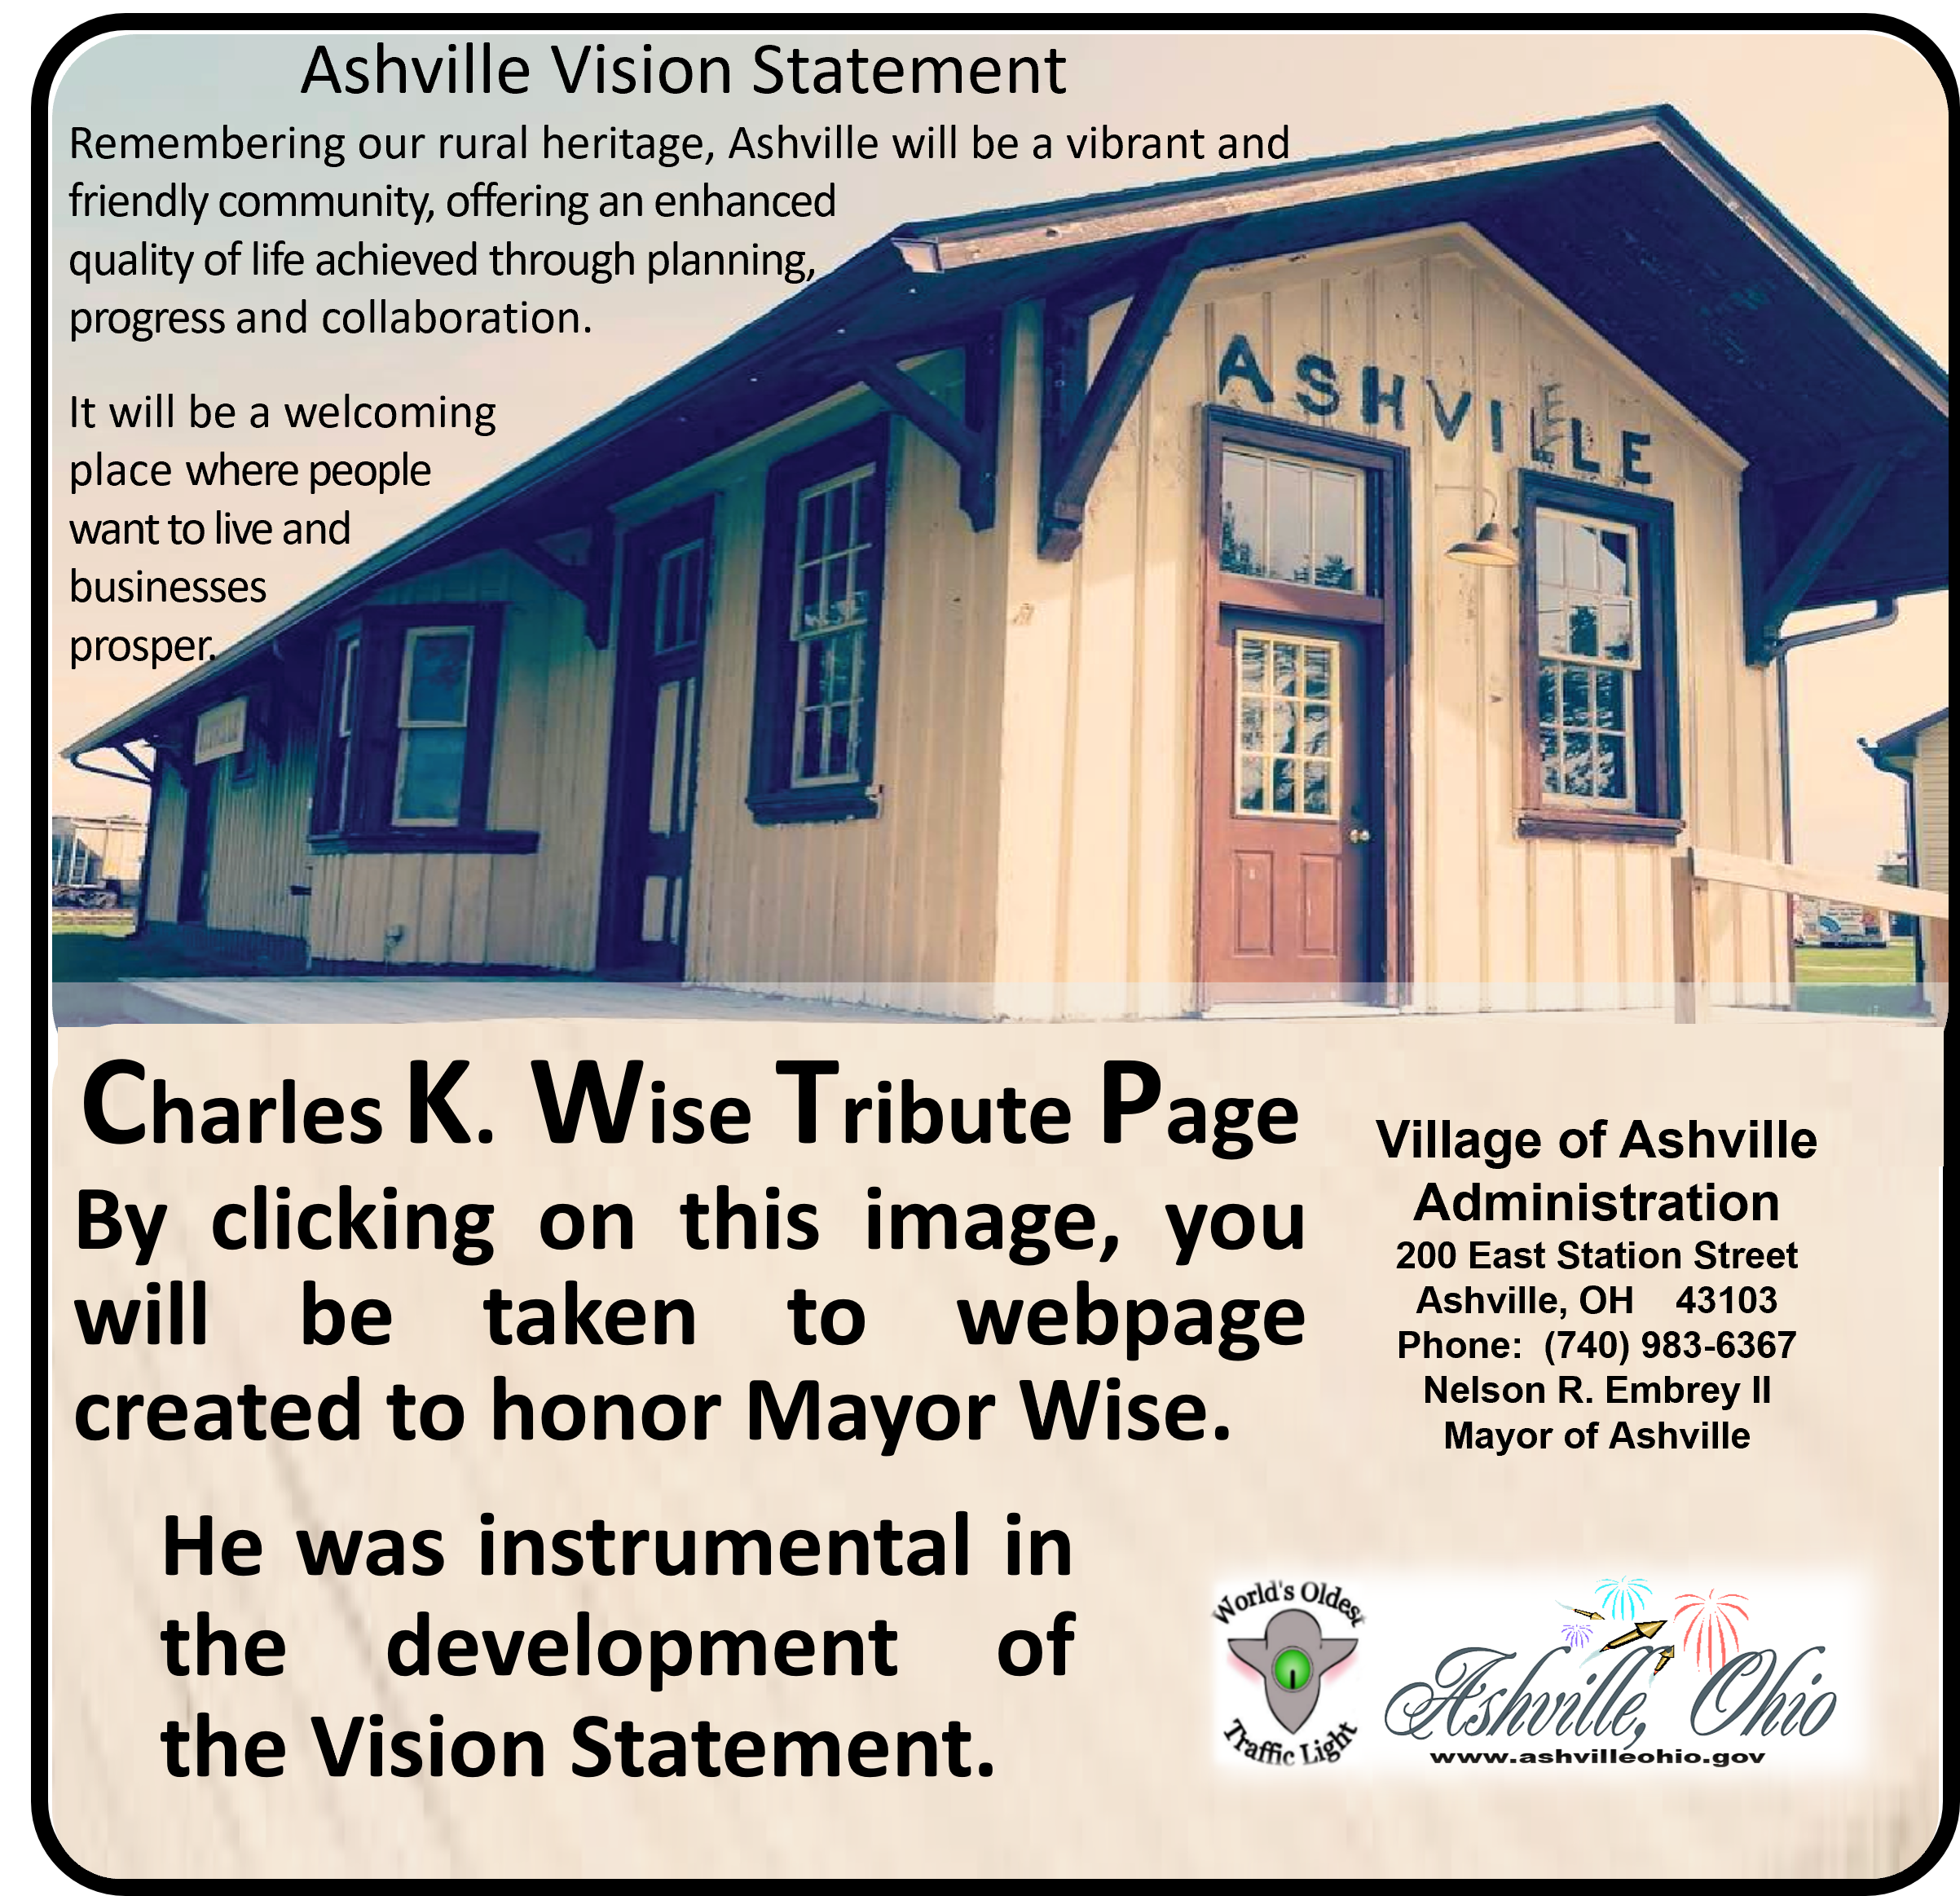
    The Vision Statement guides Ashville. Council meetings start at 6:30 pm on the 1st & 3rd Monday of each month. Schedule: http://www.ashvilleohio.gov/index.php/village-government. Click on the Banner or Read More for Tribute Information for Mayor Wise. Read More
  • Public Hearing

    Public Hearing

    A Public Hearing is scheduled for annexation of 2.432+/- acres of property (D120001001077 & D1200010010605) on Long Street/Ashville Pike. For information for this or past events click the Banner or Read More. Read More
  • Alerts & Advisories

    Alerts & Advisories

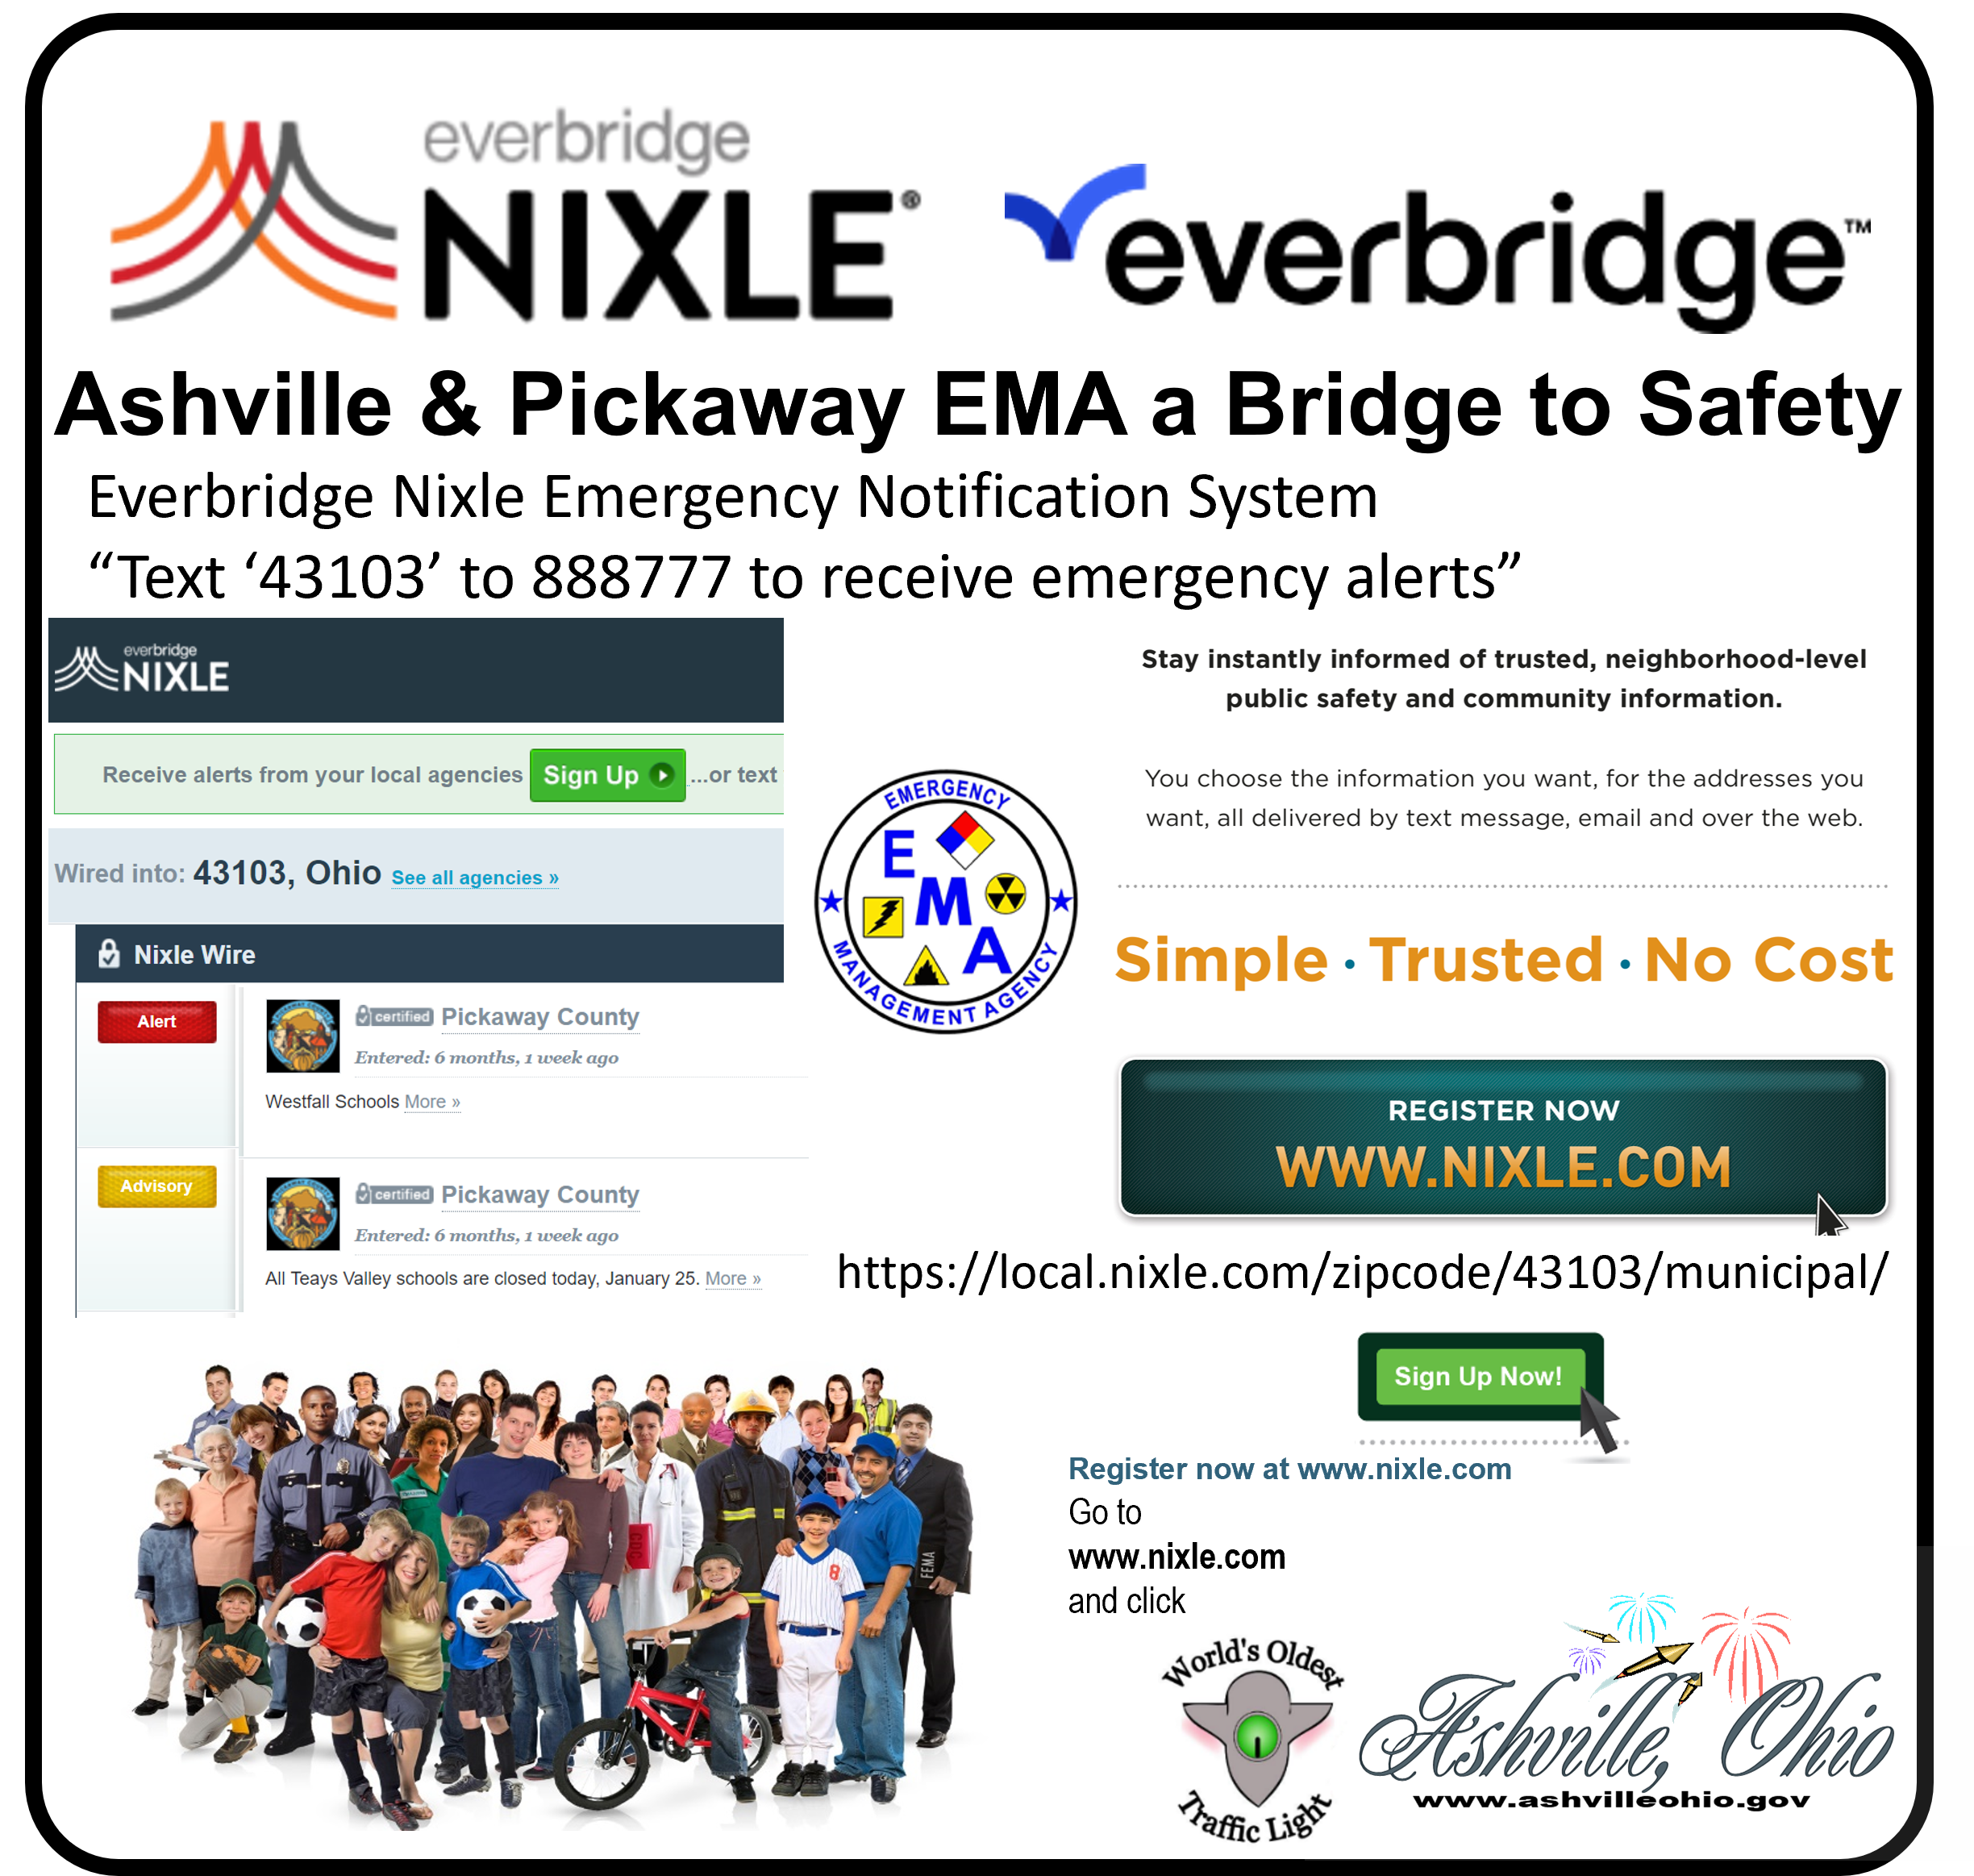
    Go to http://local.nixle.com/zipcode/43103/ municipal/ or click on the Banner or Read More. Read More
  • Planning & Zoning Project

    Planning & Zoning Project

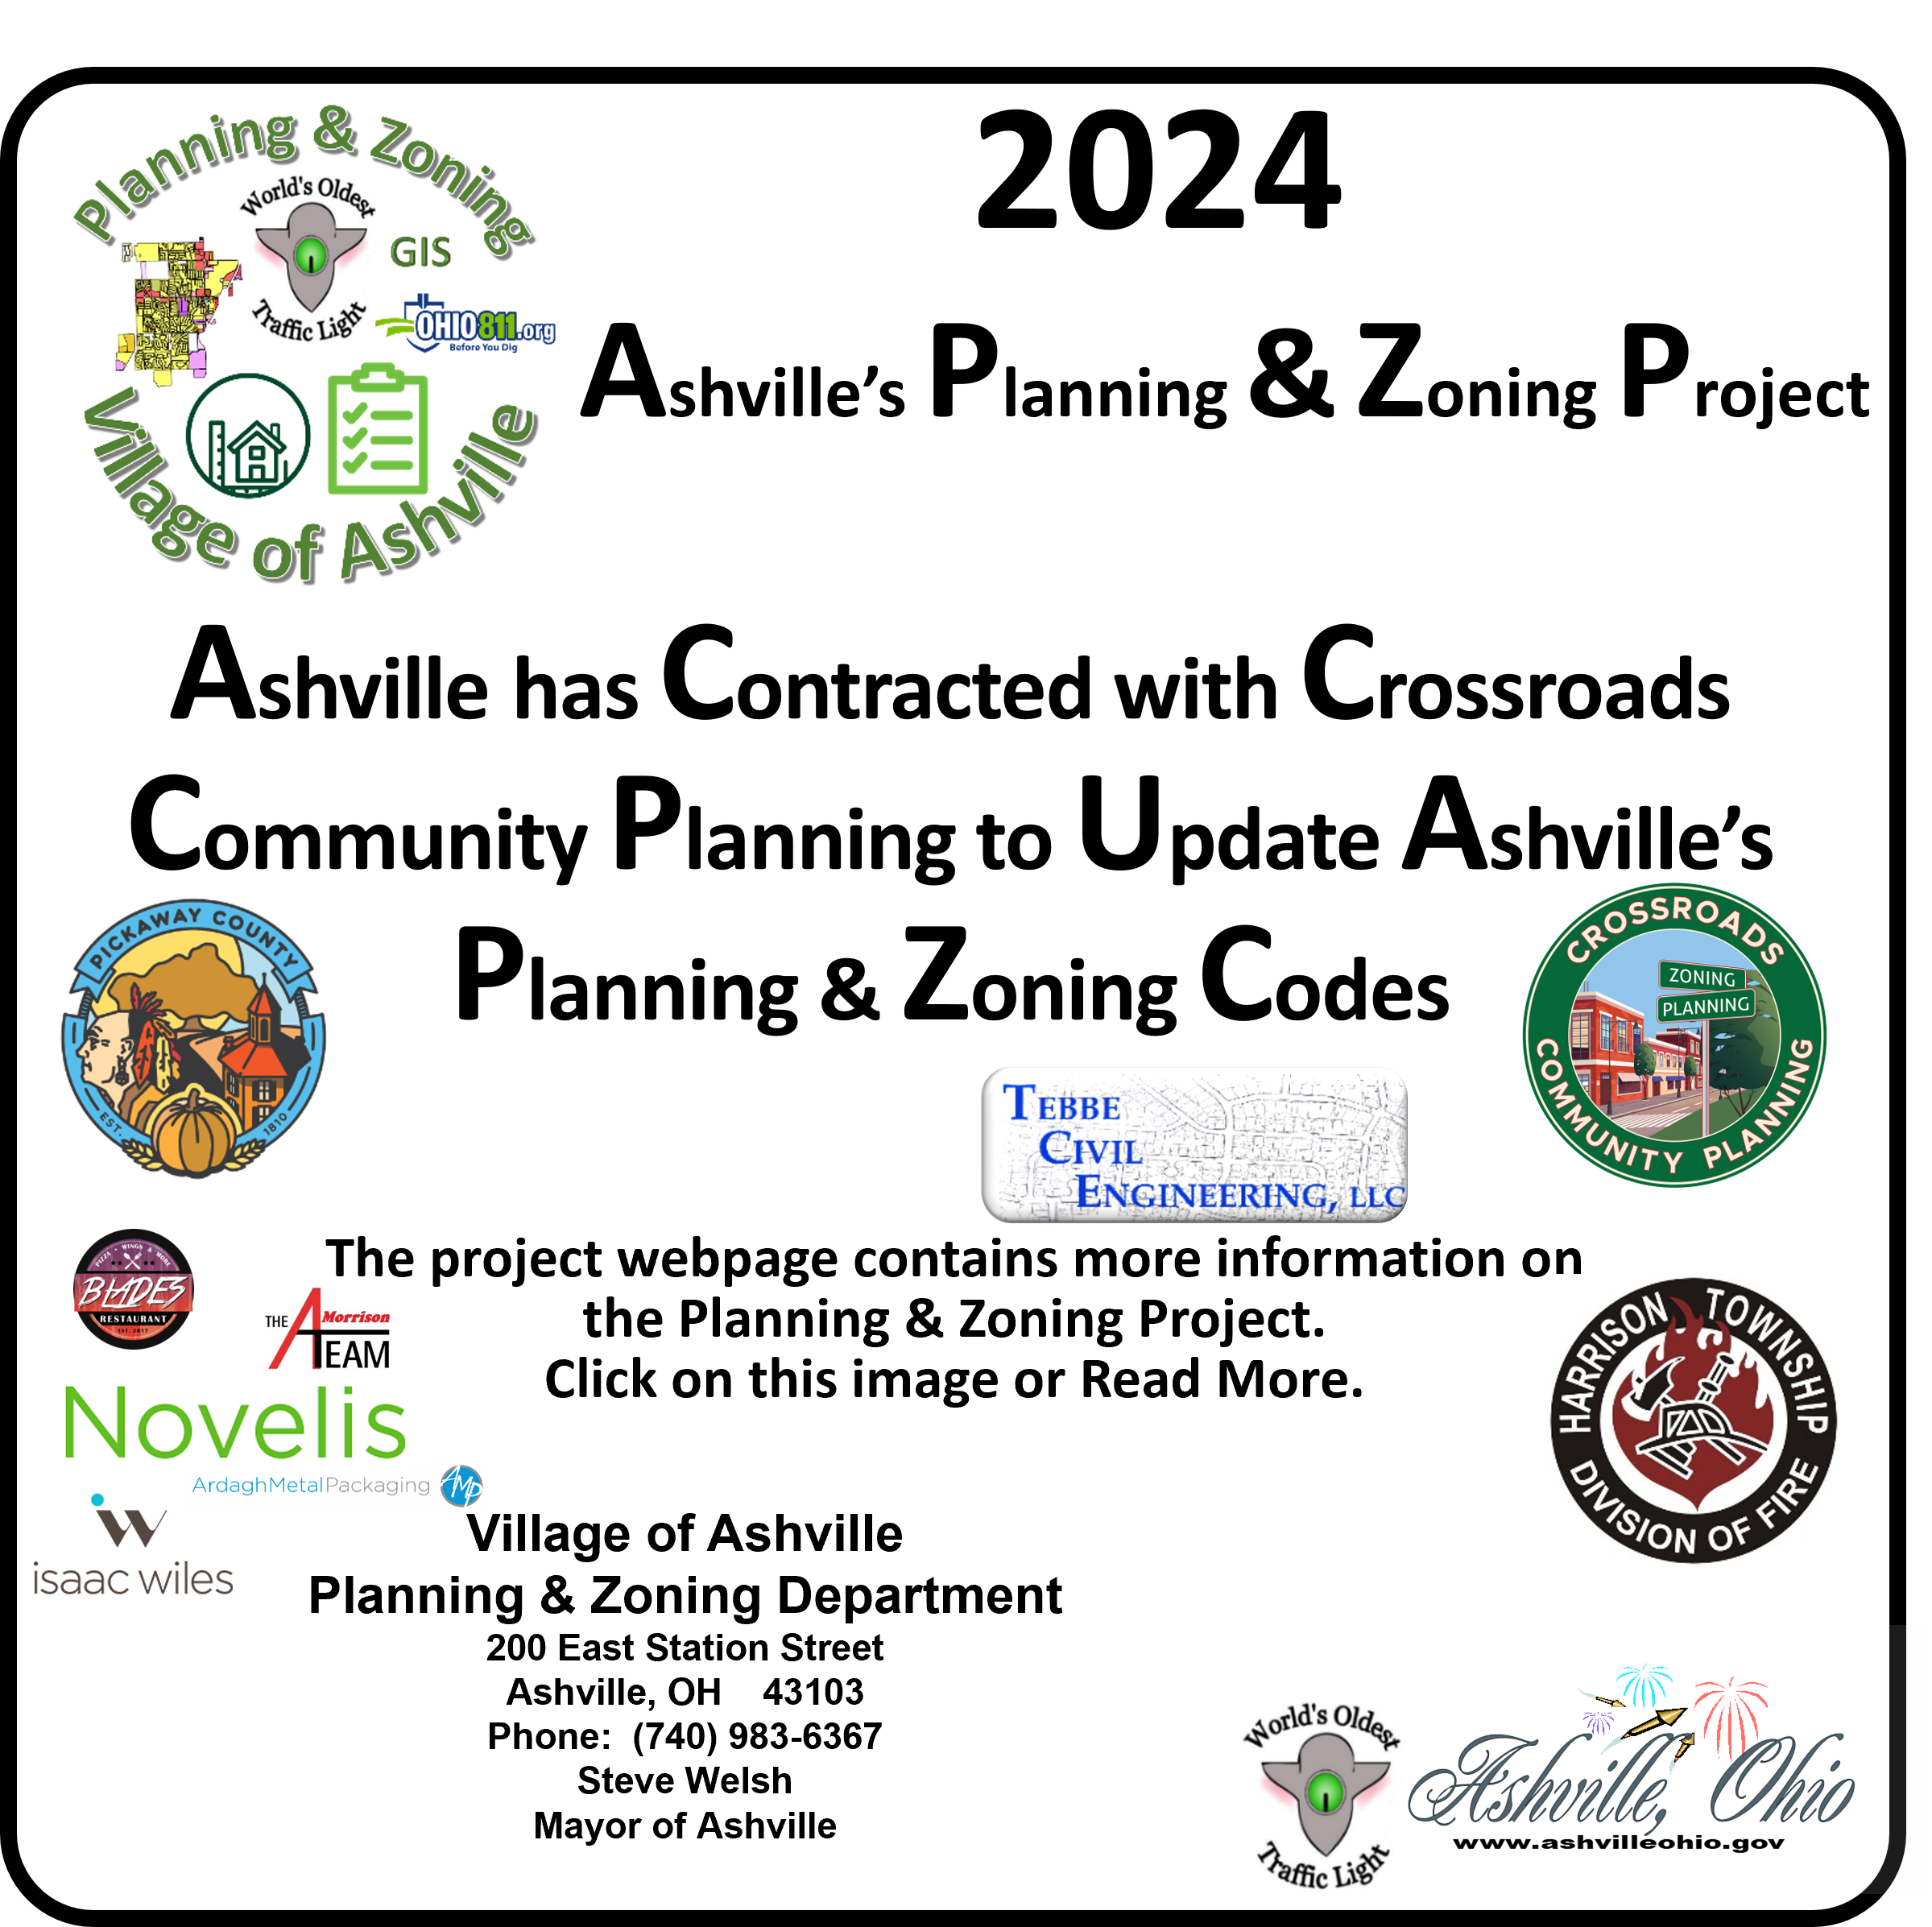
    The Village of Ashville with Crossroads Community Planning is updating its Planning & Zoning Codes. For more information click on image or "read more". Read More
  • Projects

    Projects

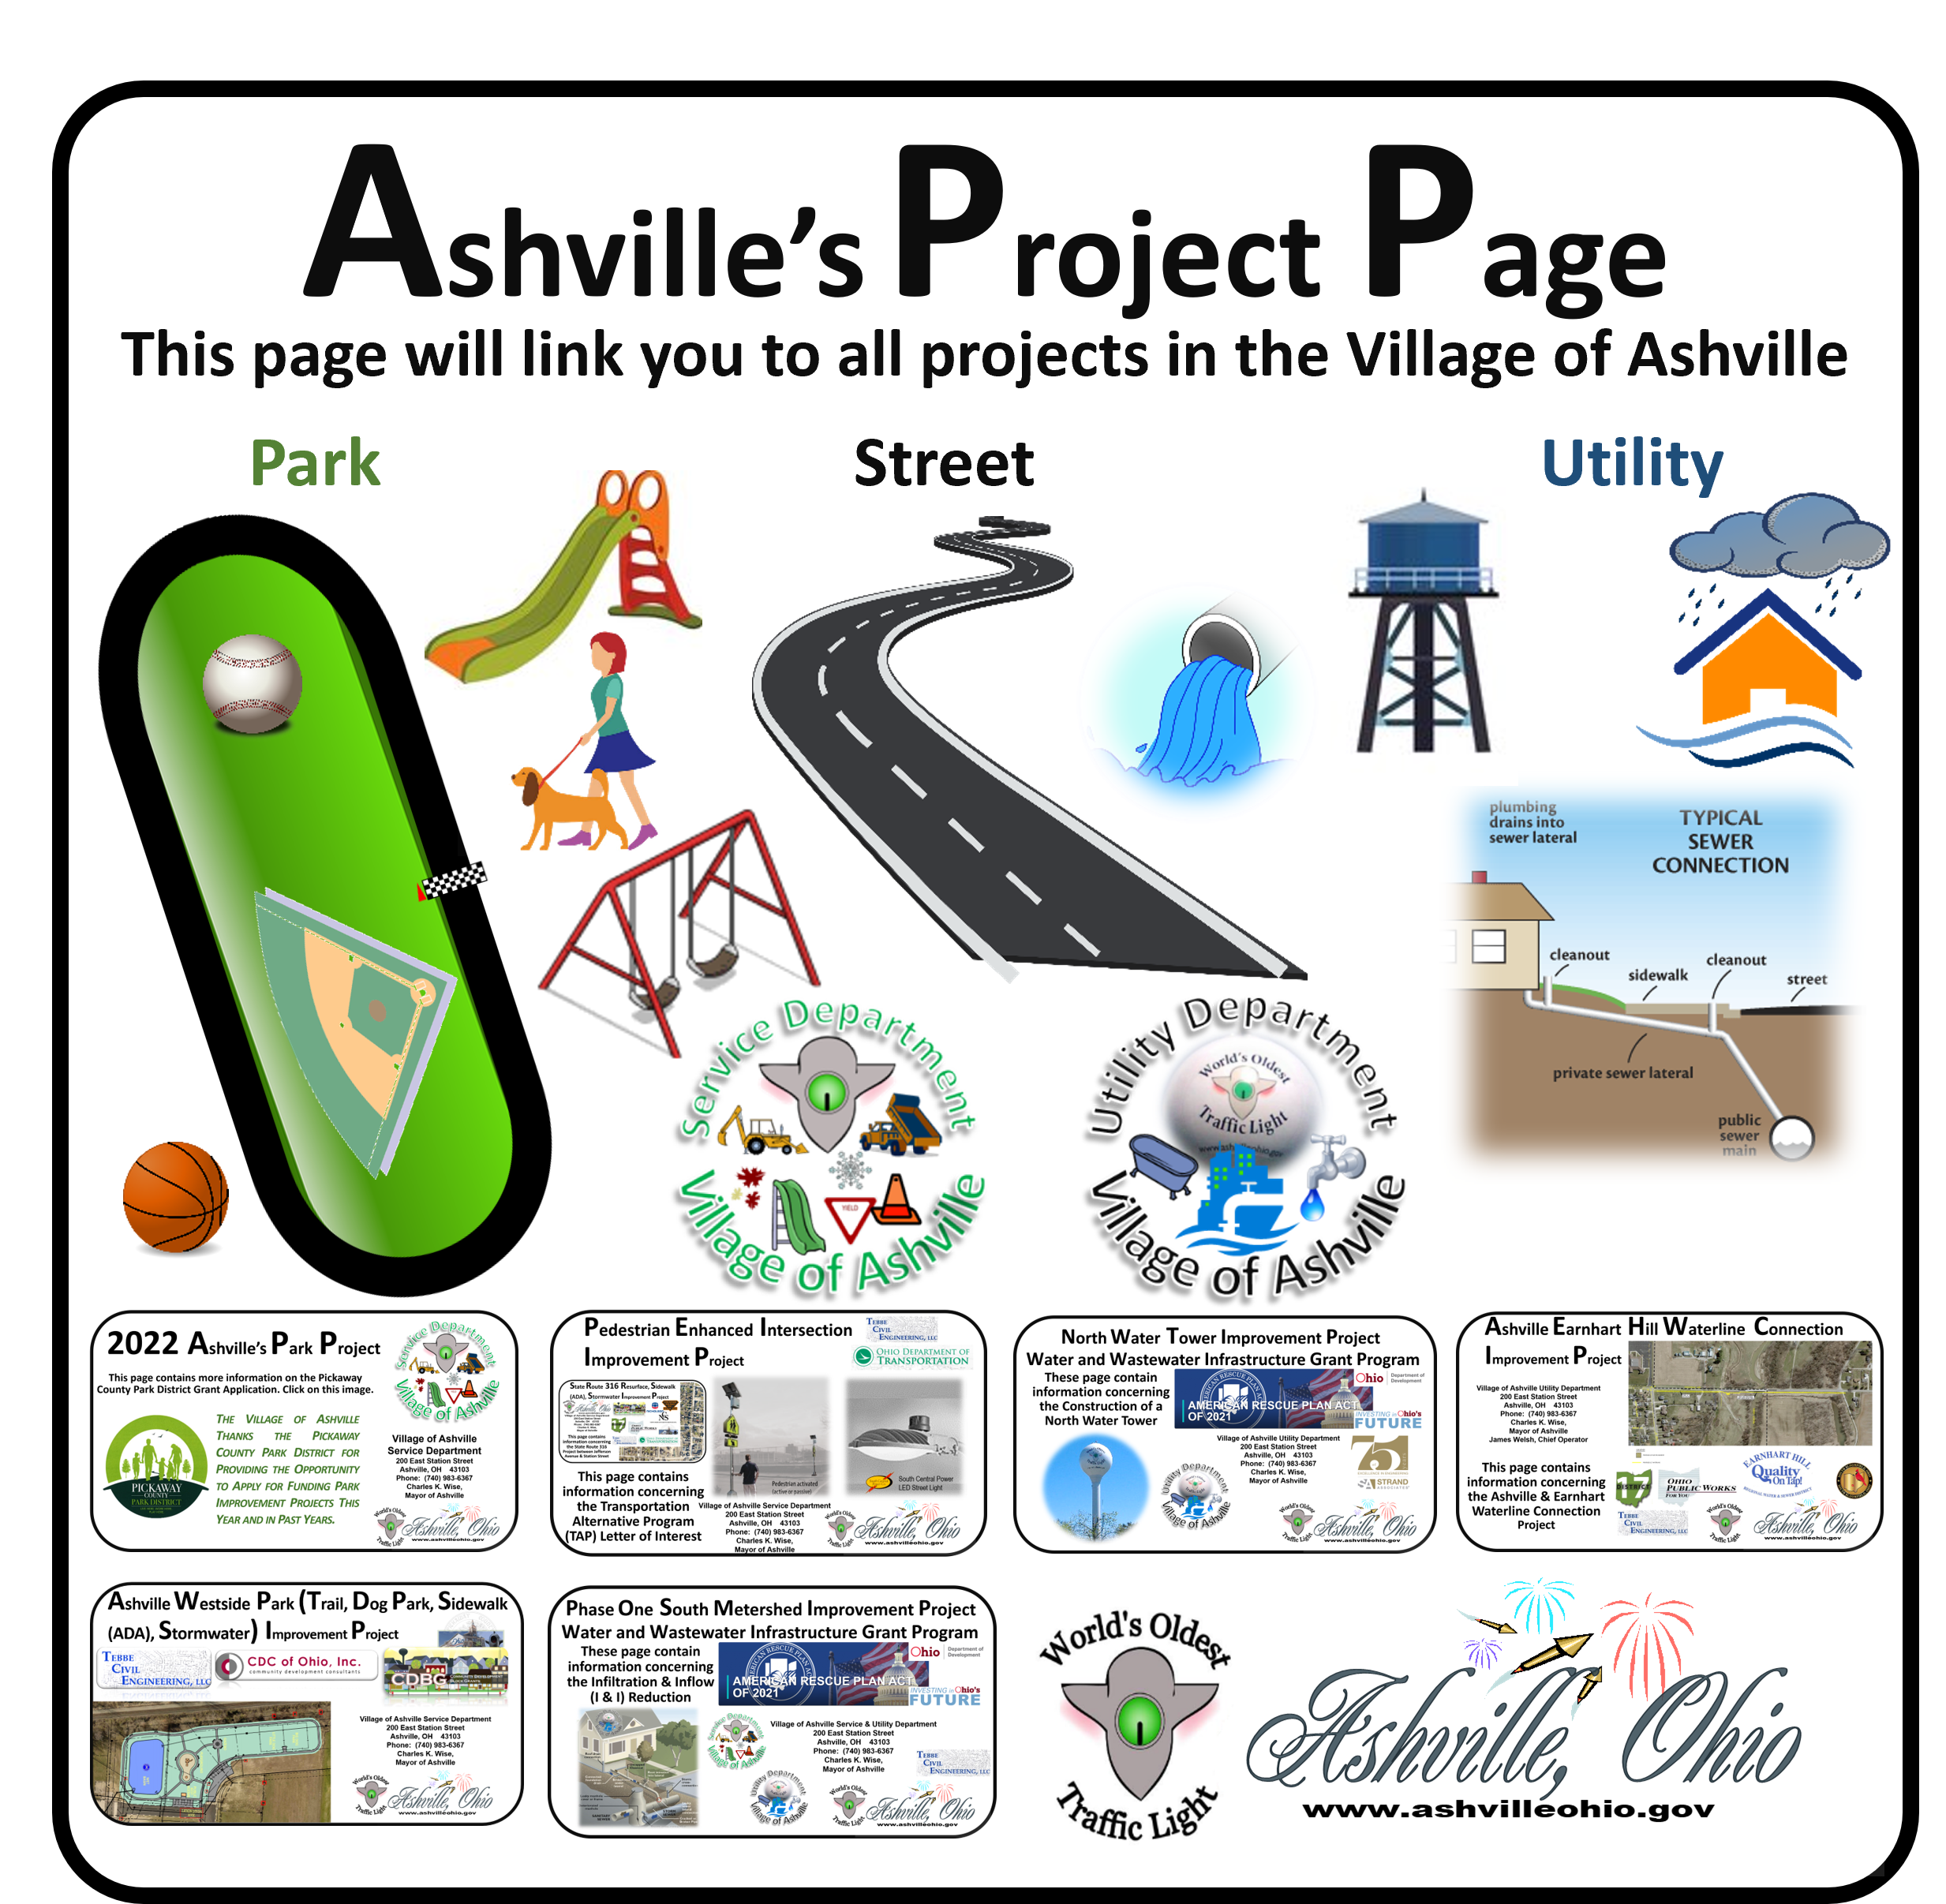
    Access information on projects for parks, streets, & utilities by clicking on the Banner or Read More. Please note that some projects may span years or may involve a combination of Ashville services. Read More
  •  Water Facility Project

    Water Facility Project

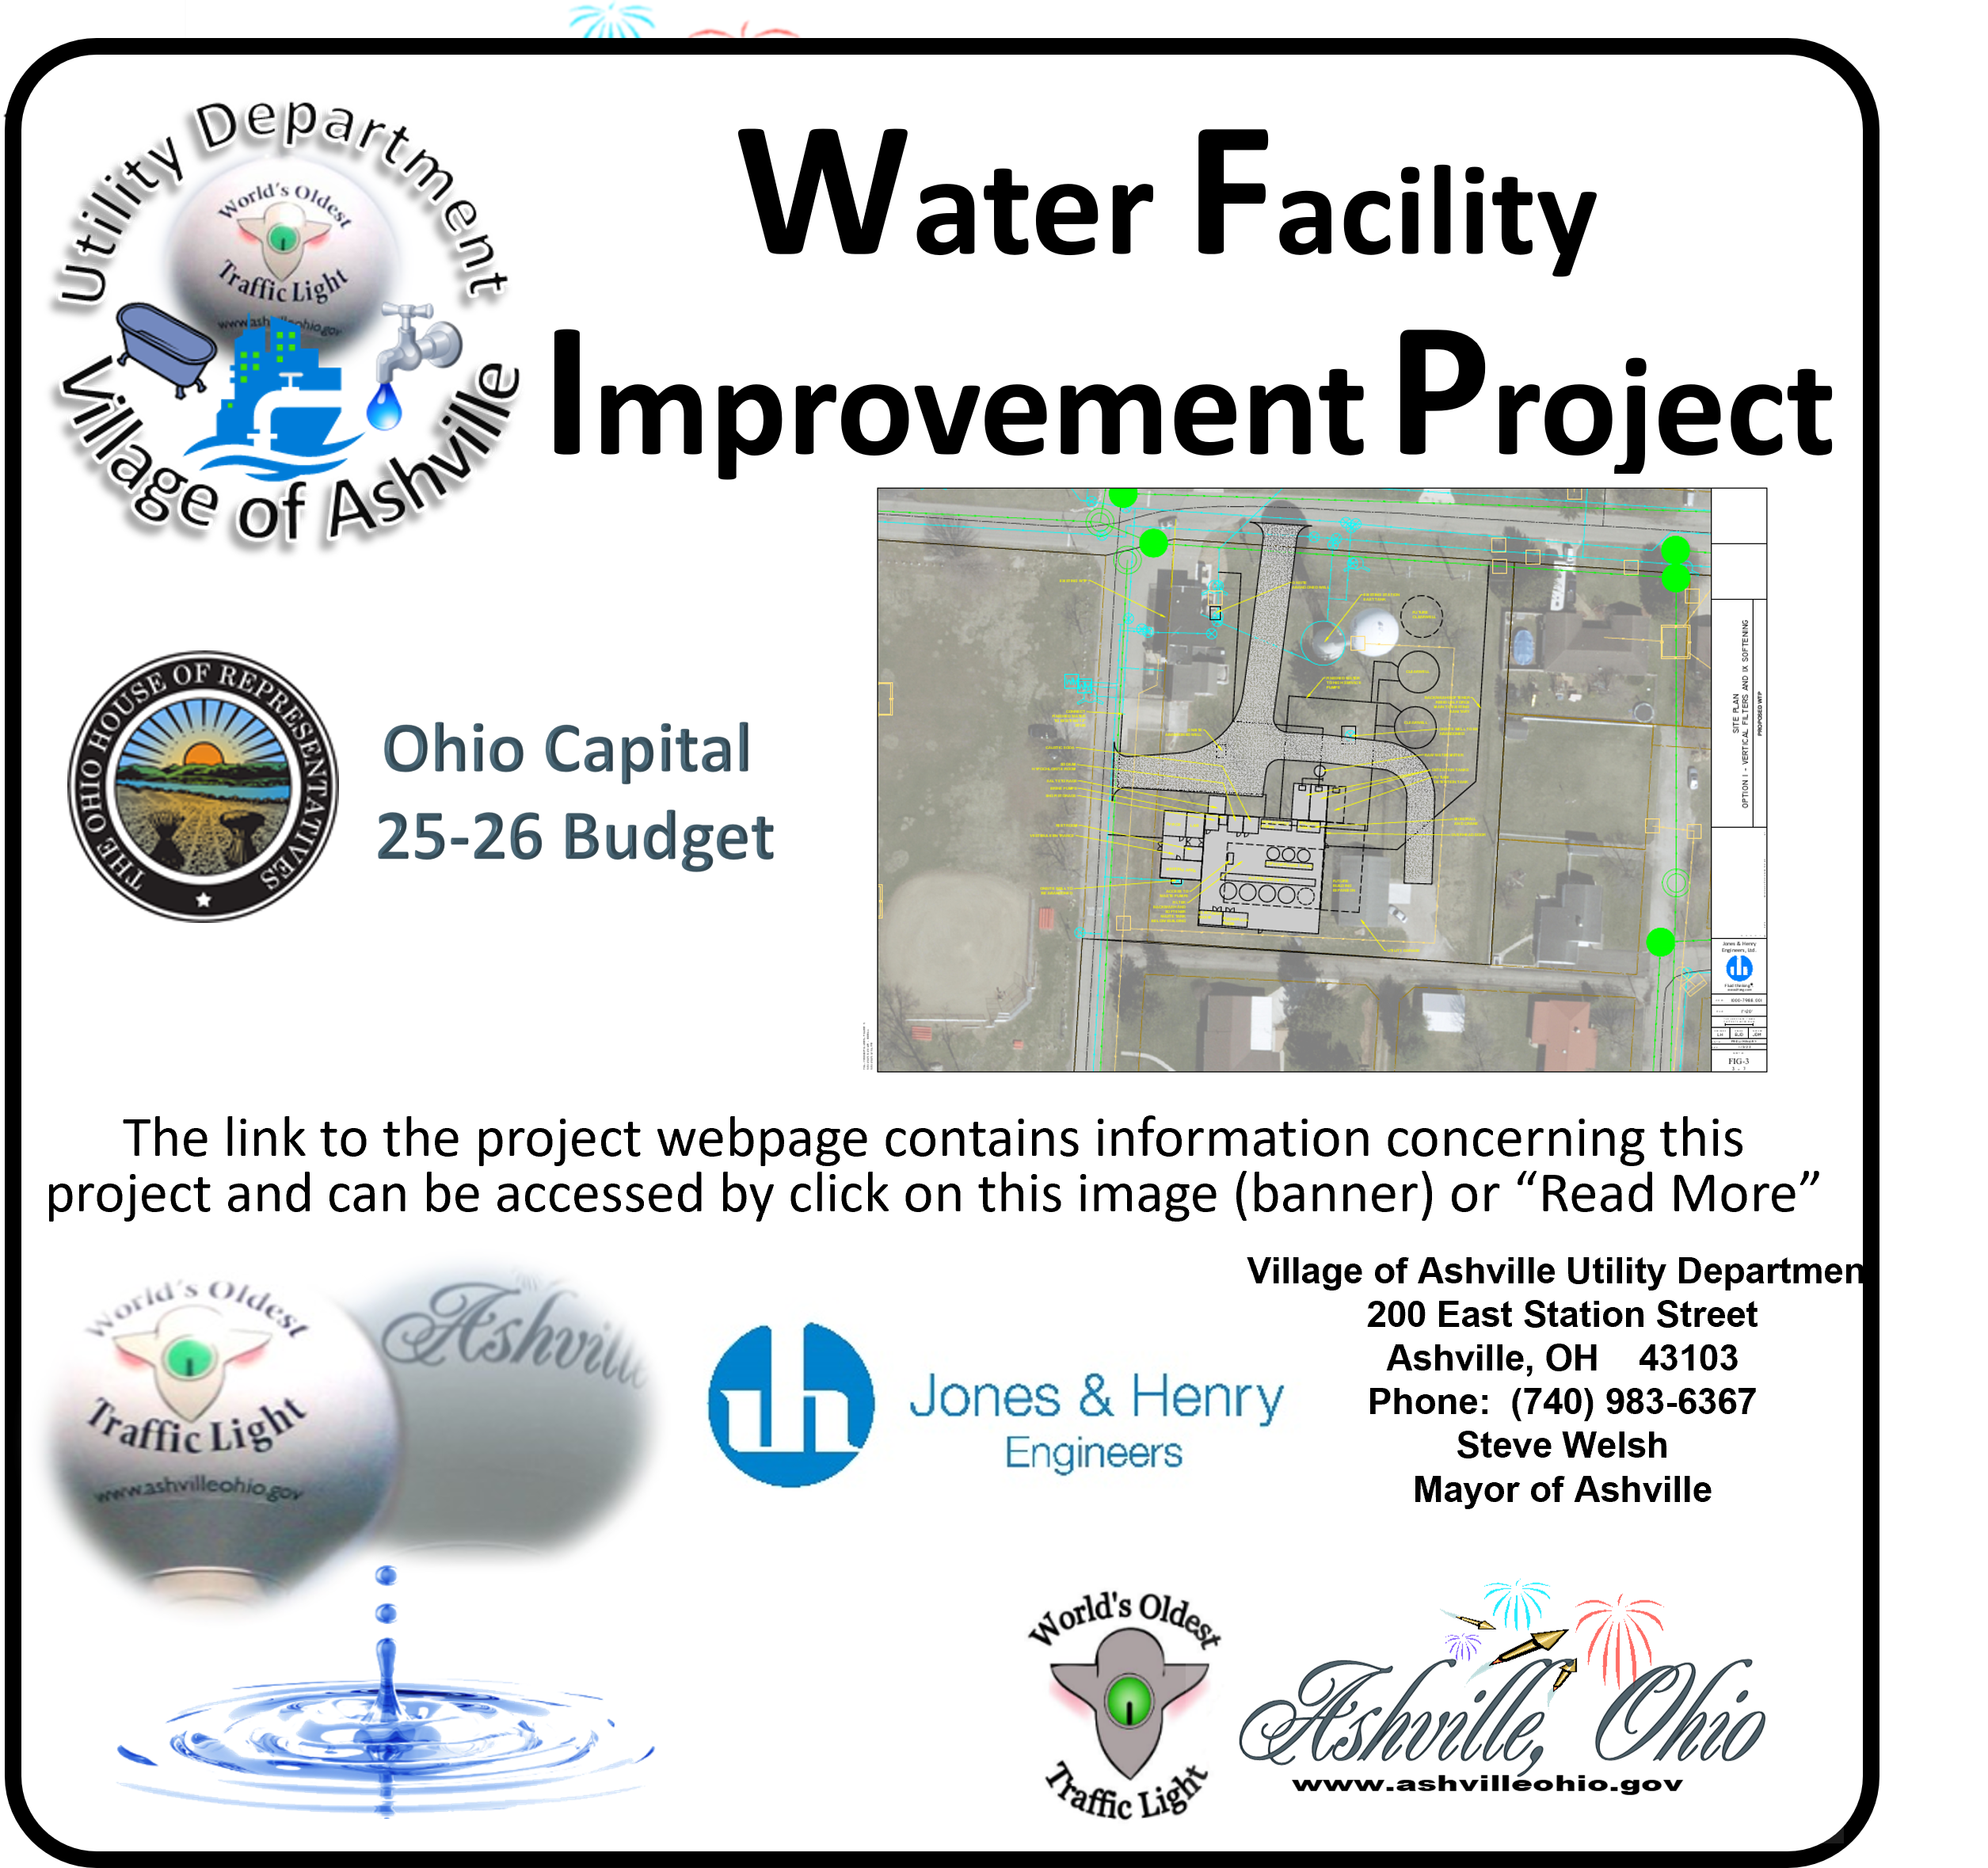
    Information about this project is found by clicking on the Banner or Read More. The webpage was developed to track and provide transparency to this process. Read More
  • Water Tower Project

    Water Tower Project

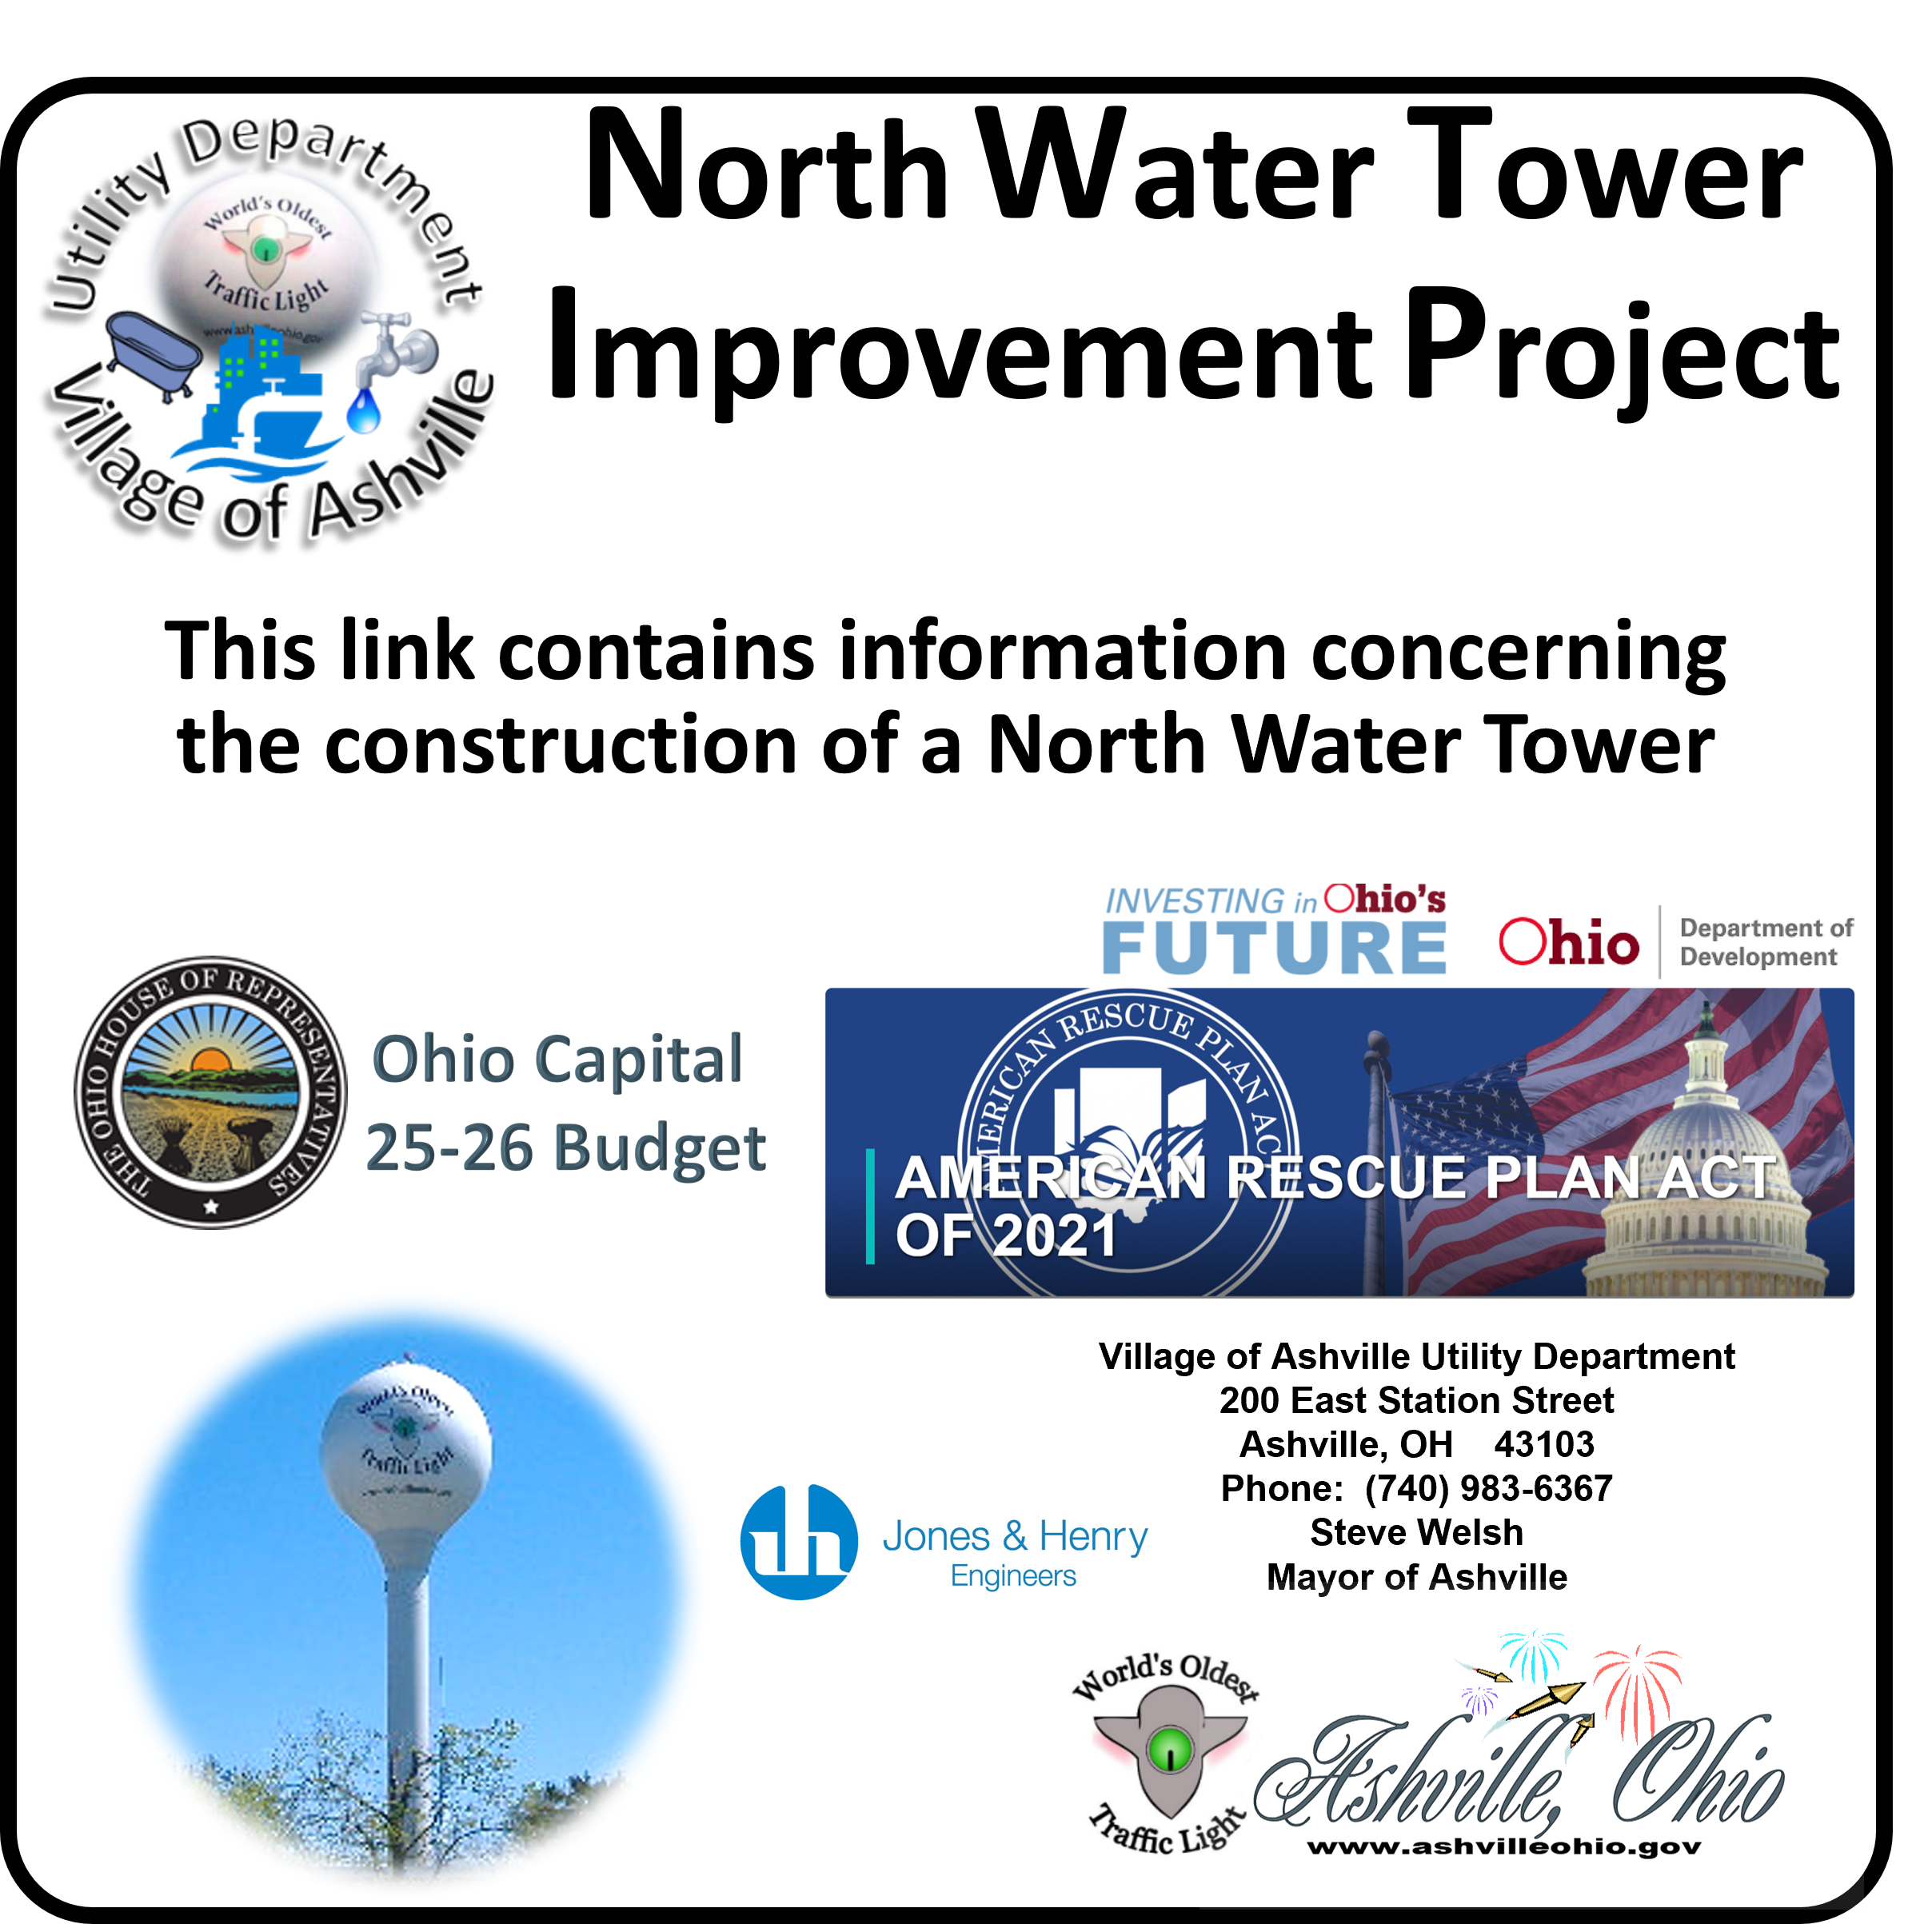
    The Village of Ashville is working on replacing the Cromley Water Tower with a North Water Tower. Click on read more or the banner for more information. Read More
  • Water Connection Projects

    Water Connection Projects

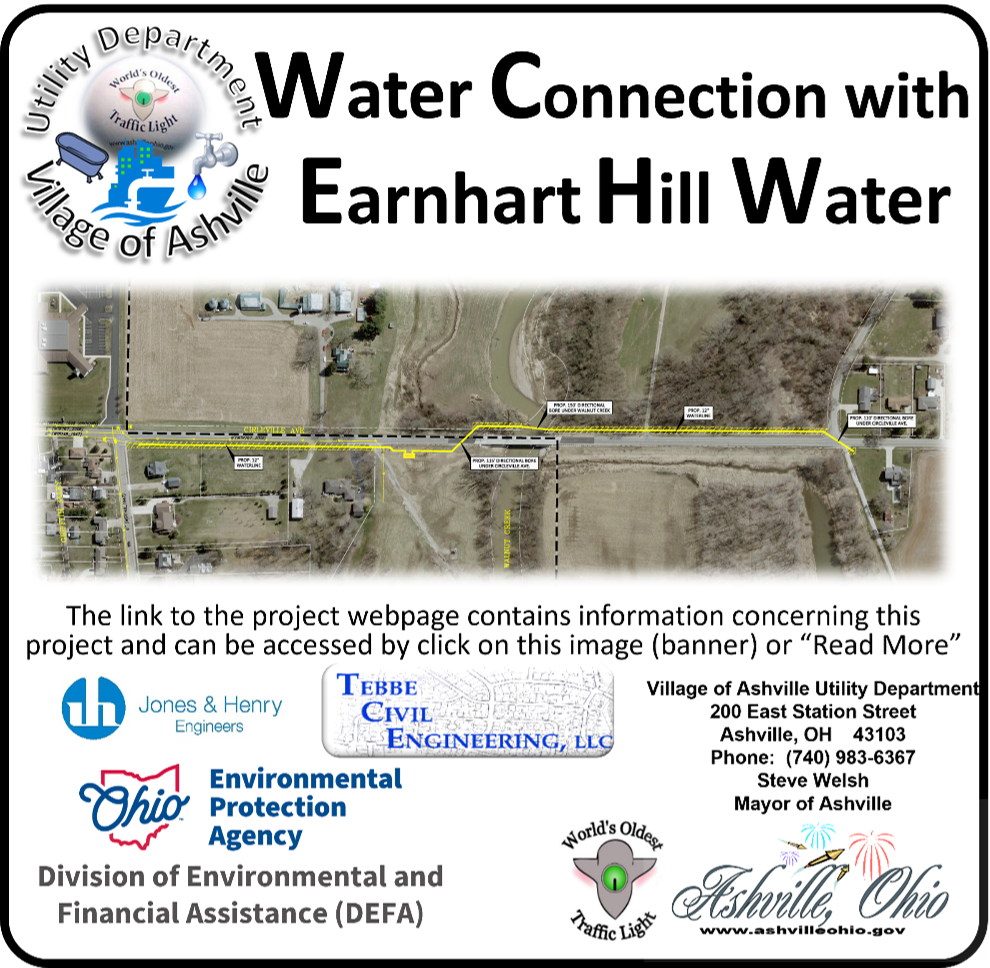
    Information about these projects are found by clicking on the Banner or Read More. Earnhart Hill & South Bloomfield(Completed) Water Connection. The webpage was developed to track and provide transparency to this process. Read More
  • Phase II of the State Route 316 Project

    Phase II of the State Route 316 Project

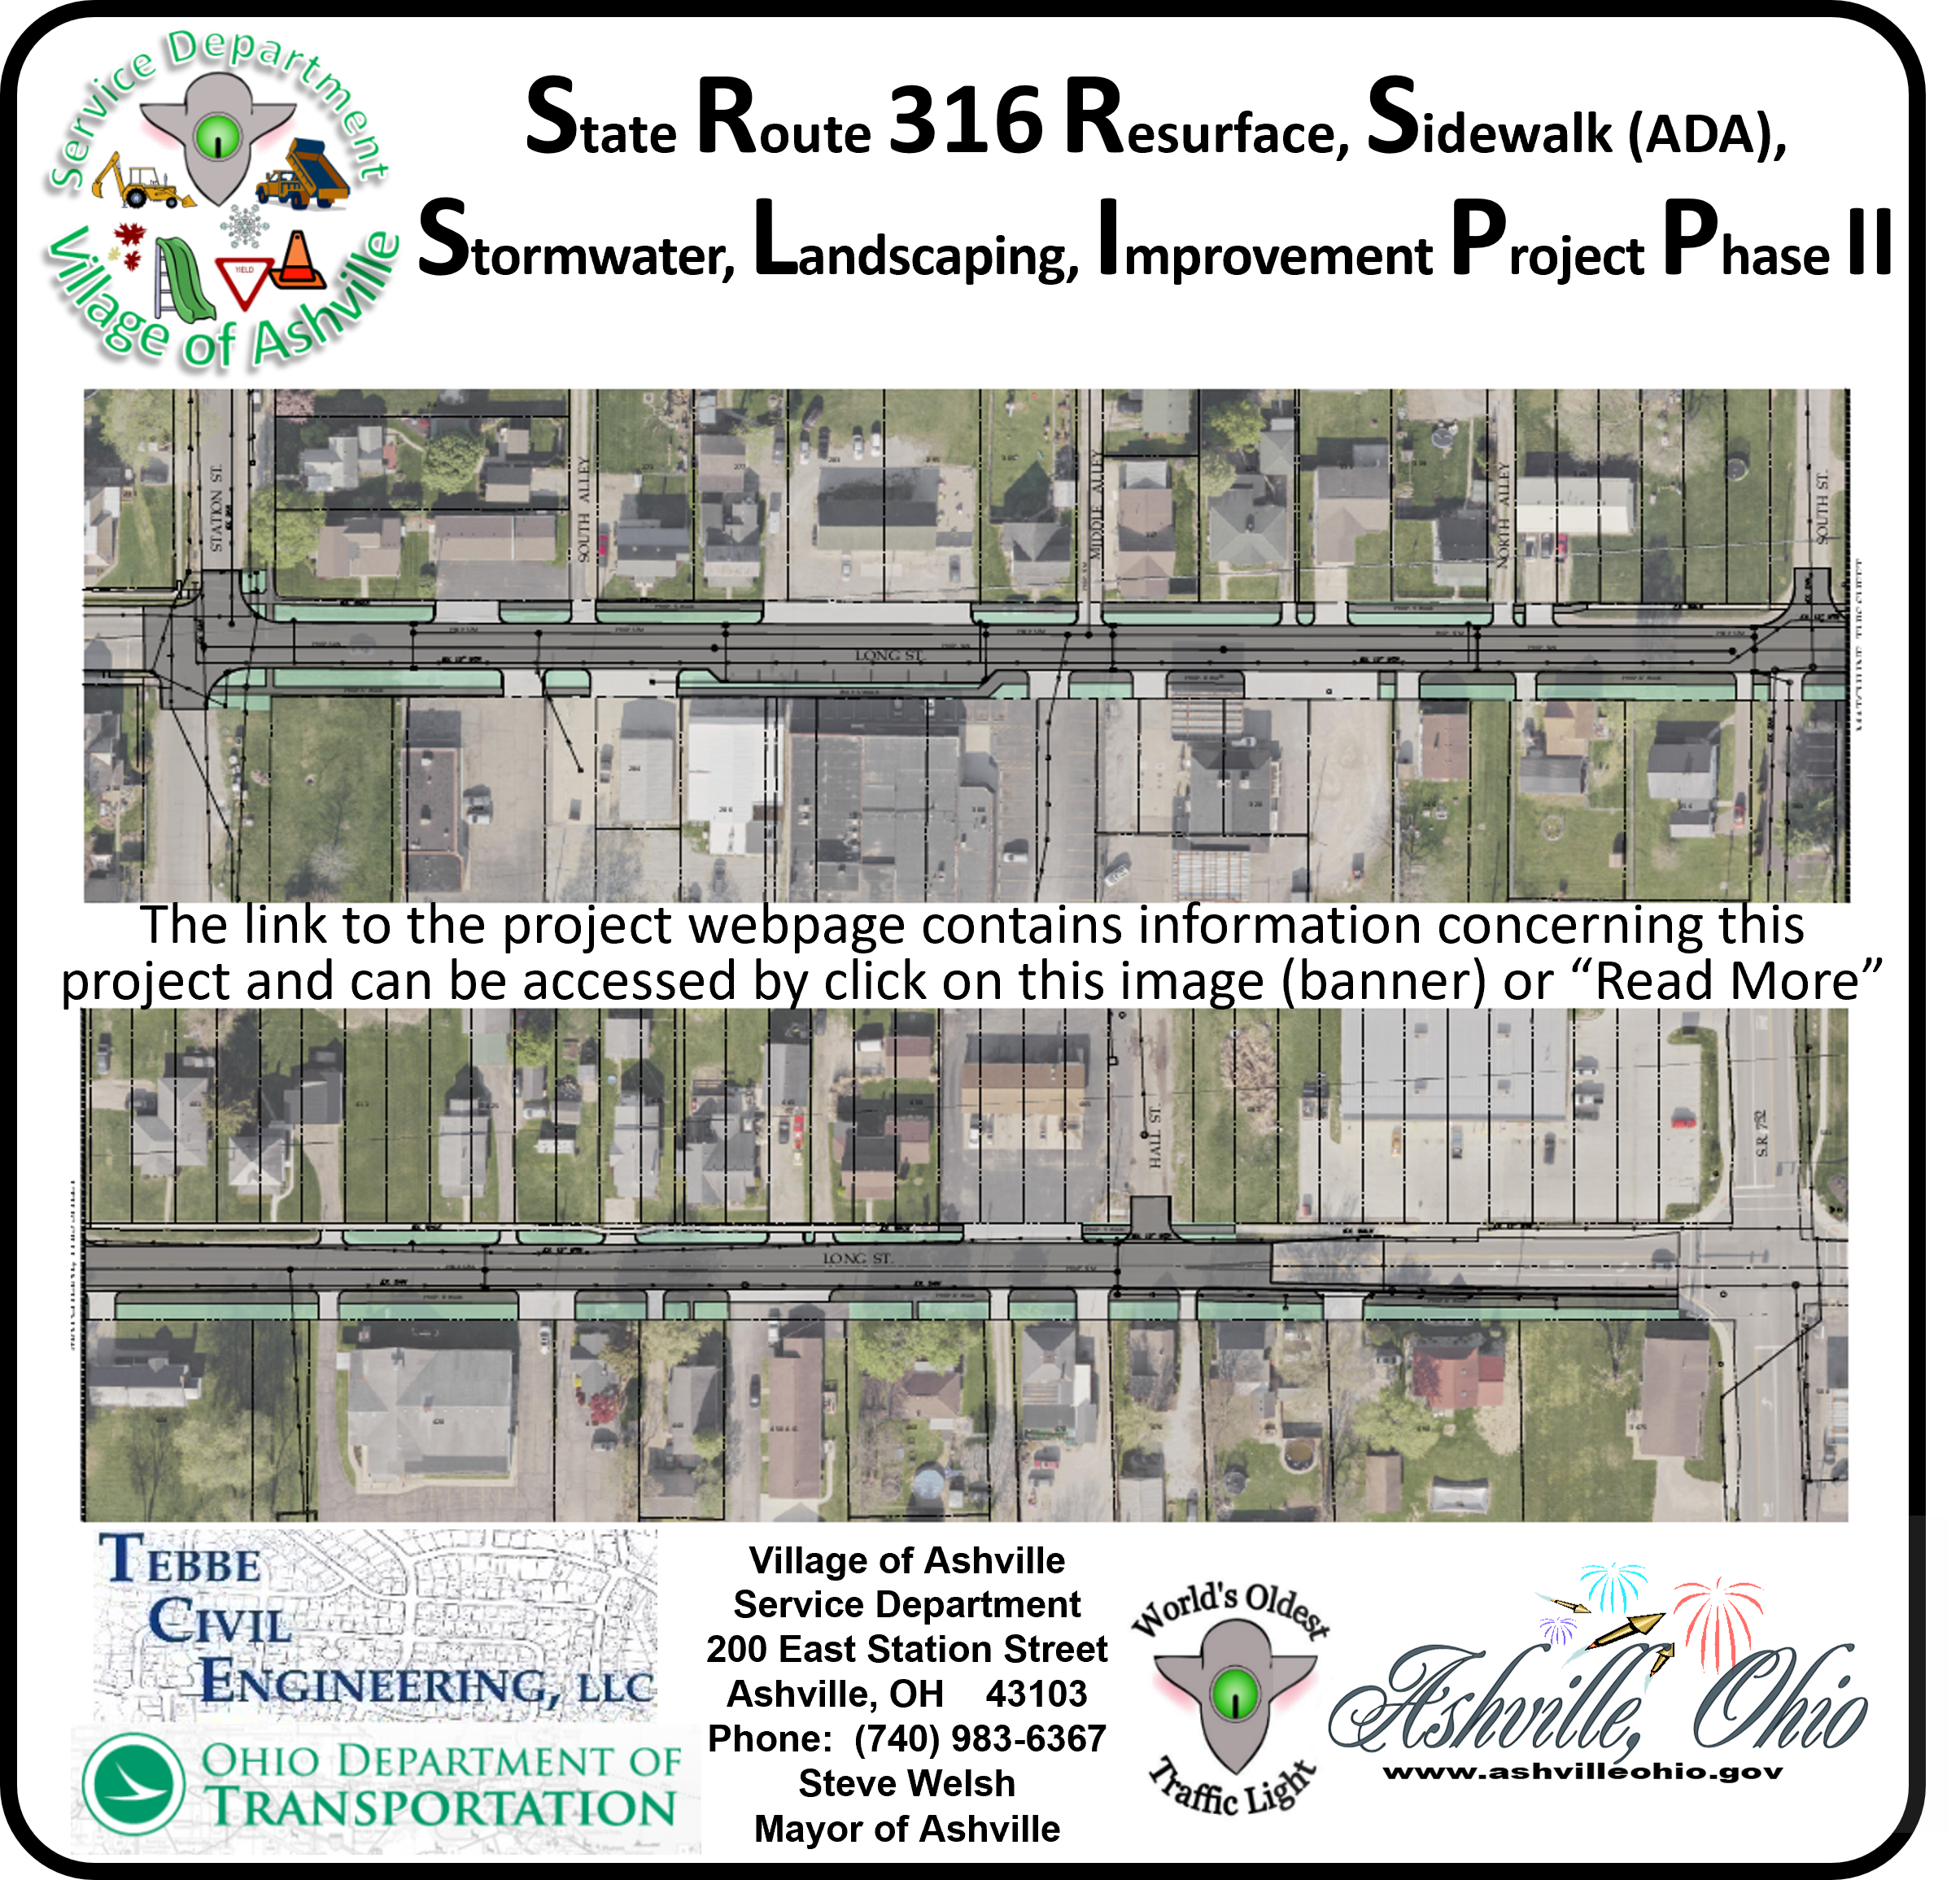
    The Phase II State Route 316 Project is from Station Street to SR 752. Click on Read More of the Banner to access more information. Read More
  • 2024 & 25 Paving Project

    2024 & 25 Paving Project

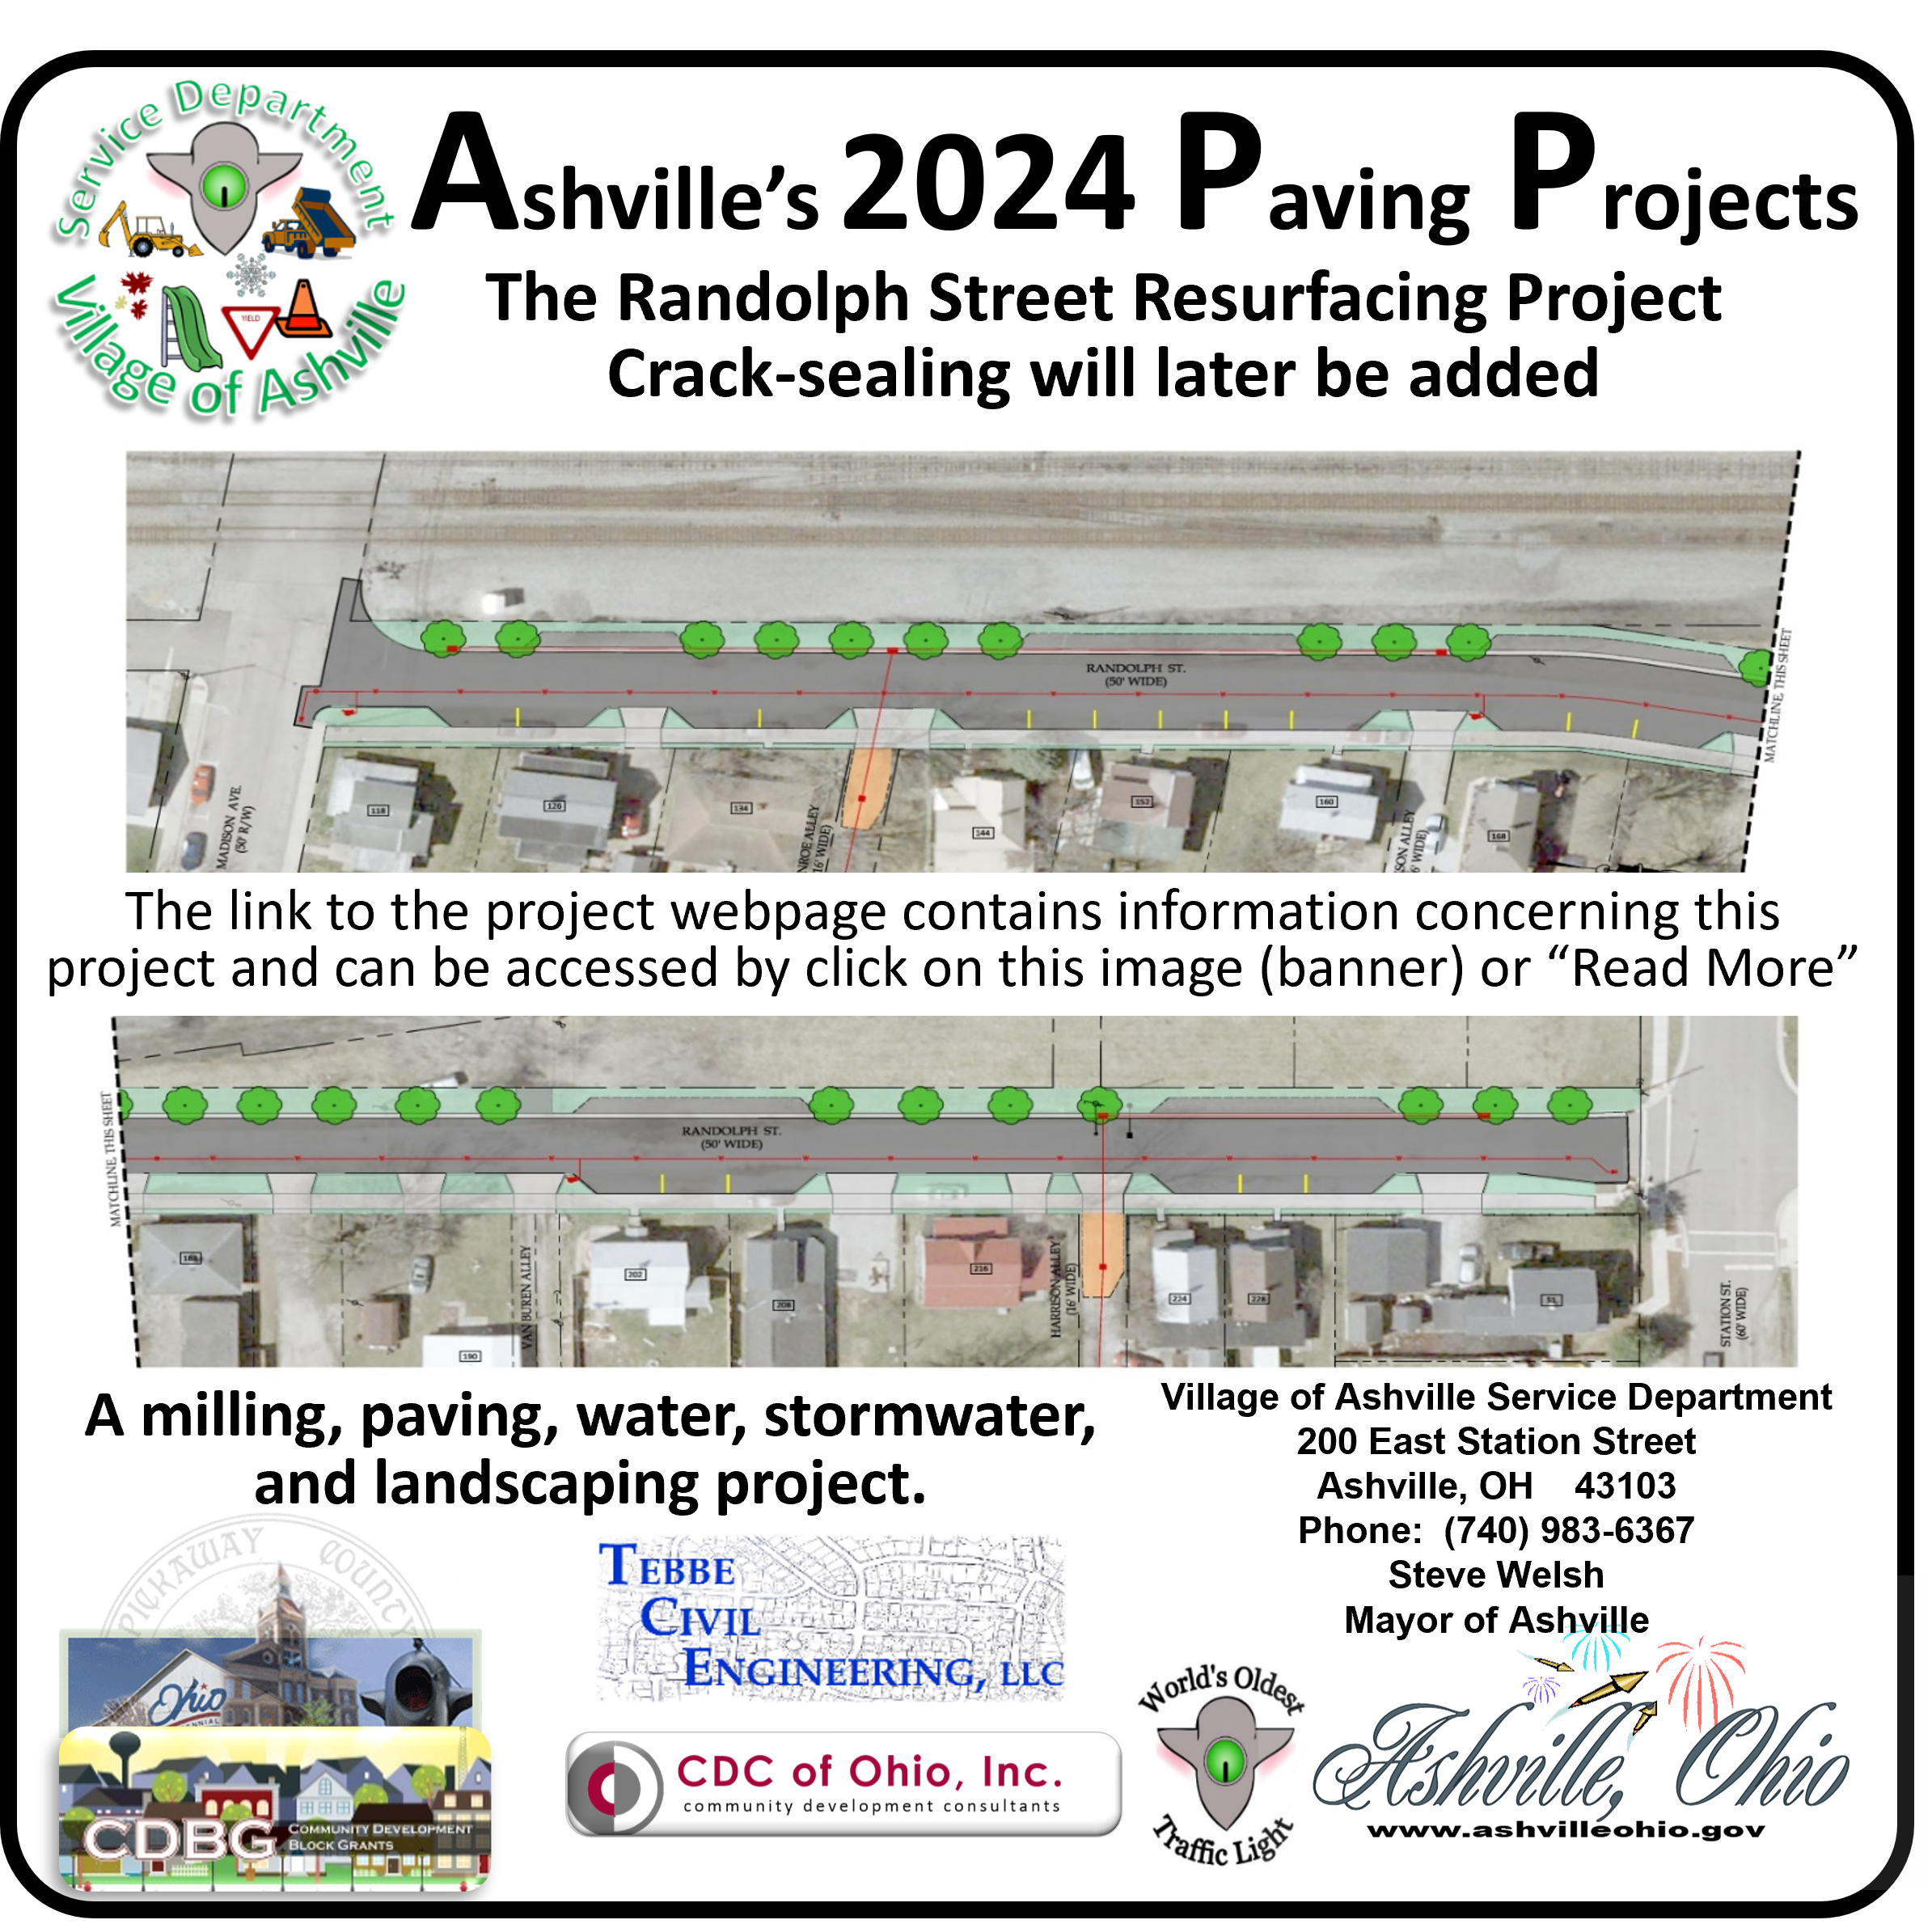
    Summary information on 2024 Randolph Street Paving Project. For more detailed information you can be linked to the project webpage by clicking on the Banner to the right or Read More Read More
  • Water Resource Recovery Facility Expansion

    Water Resource Recovery Facility Expansion

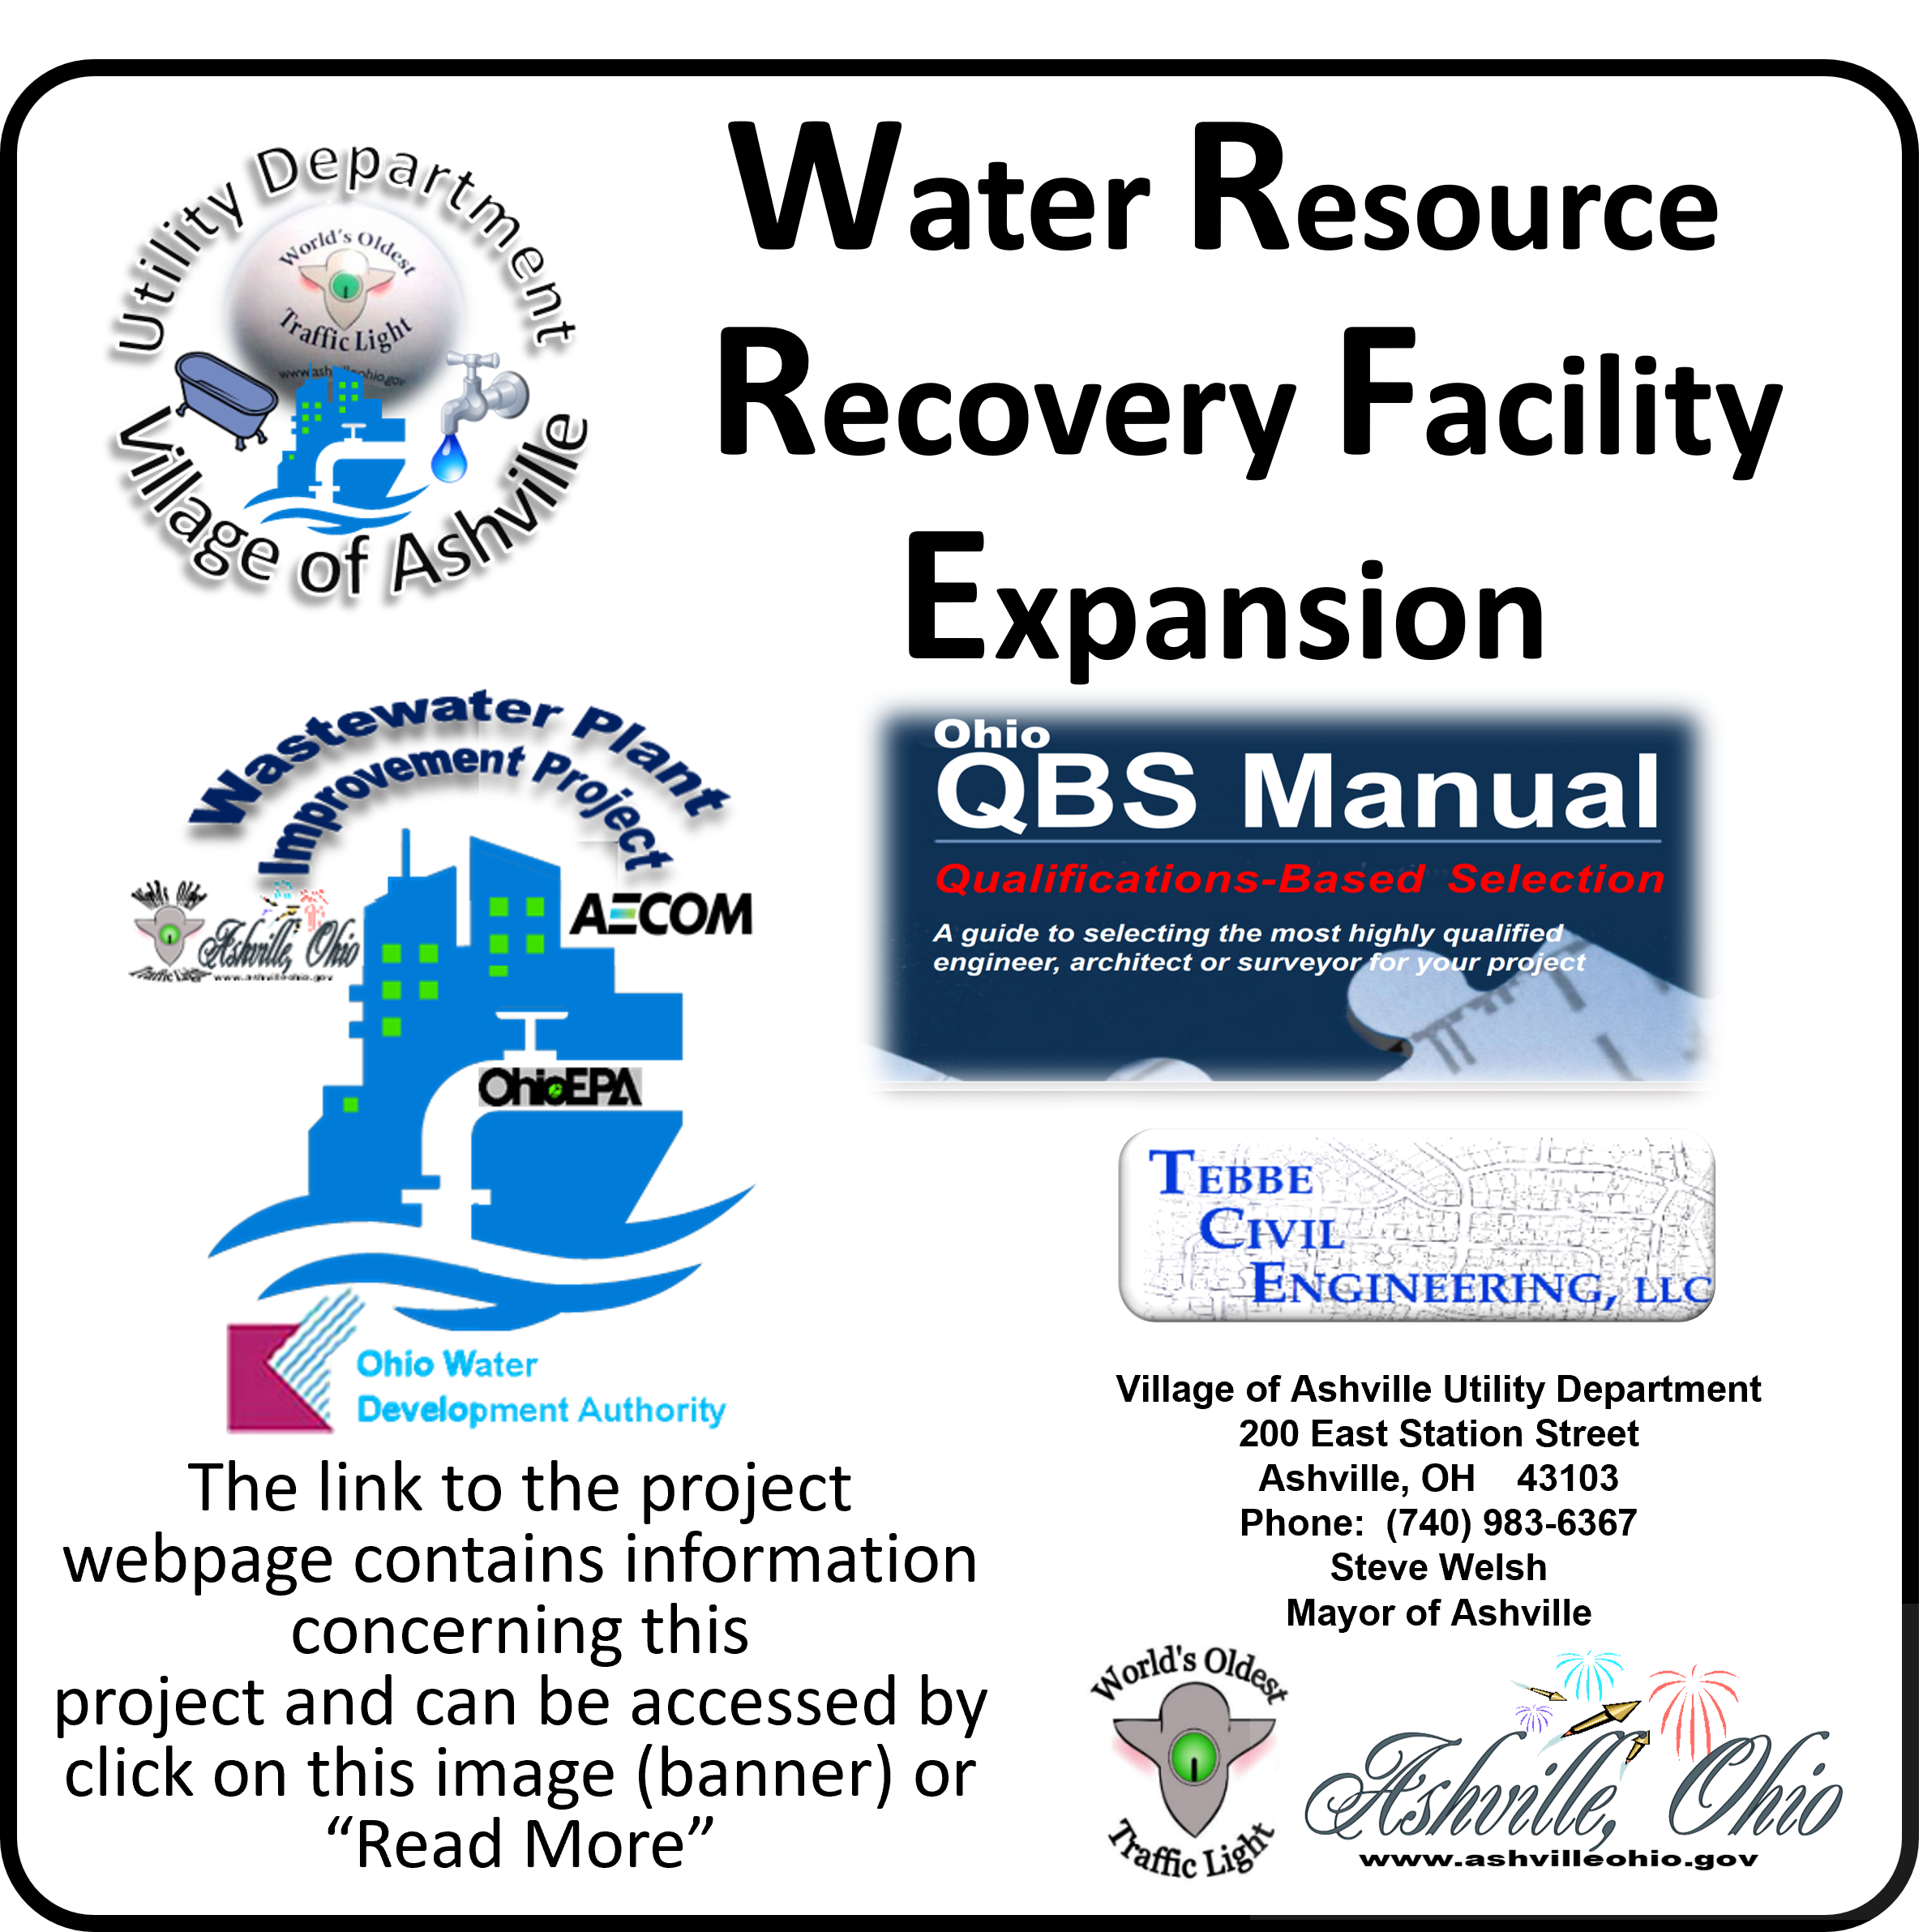
    Information about this project is found by clicking on the Banner or Read More. The webpage was developed to track and provide transparency to this process. Read More
  • Westside Park Project

    Westside Park Project

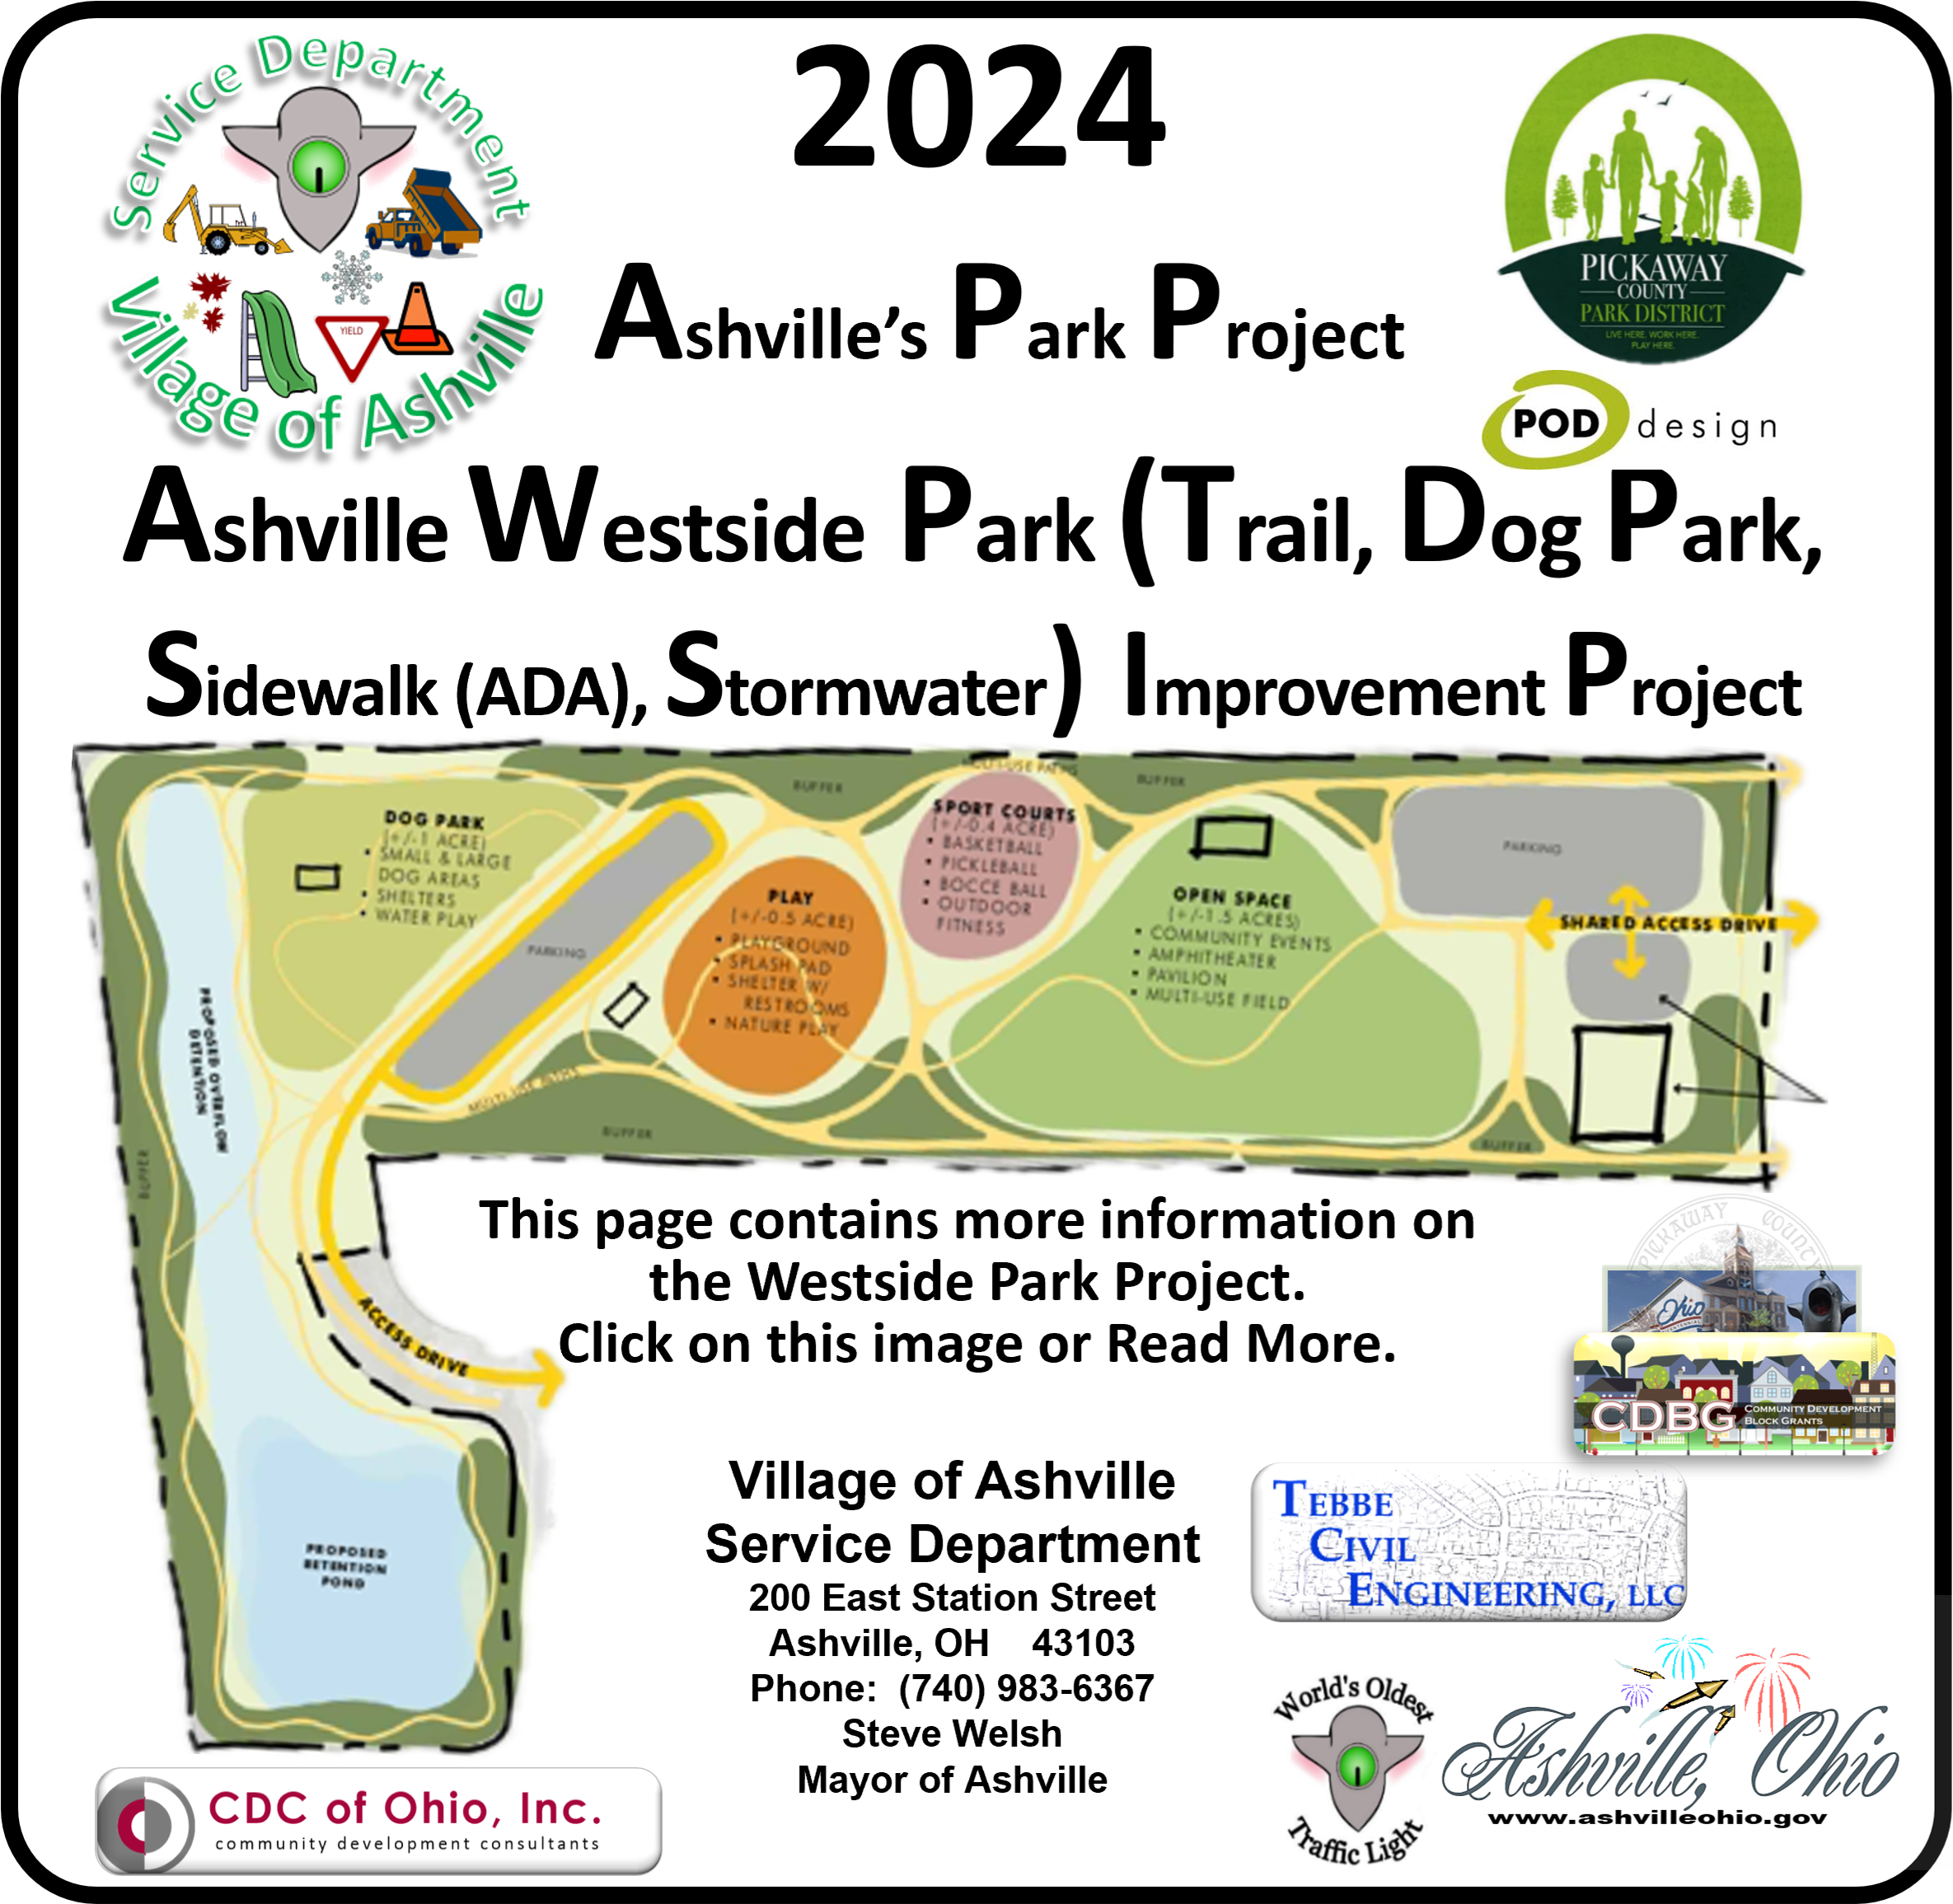
    Submitted Westside Park in 2022 and in 2024. Click on image or read more for Information. Read More
  • Park

    Park

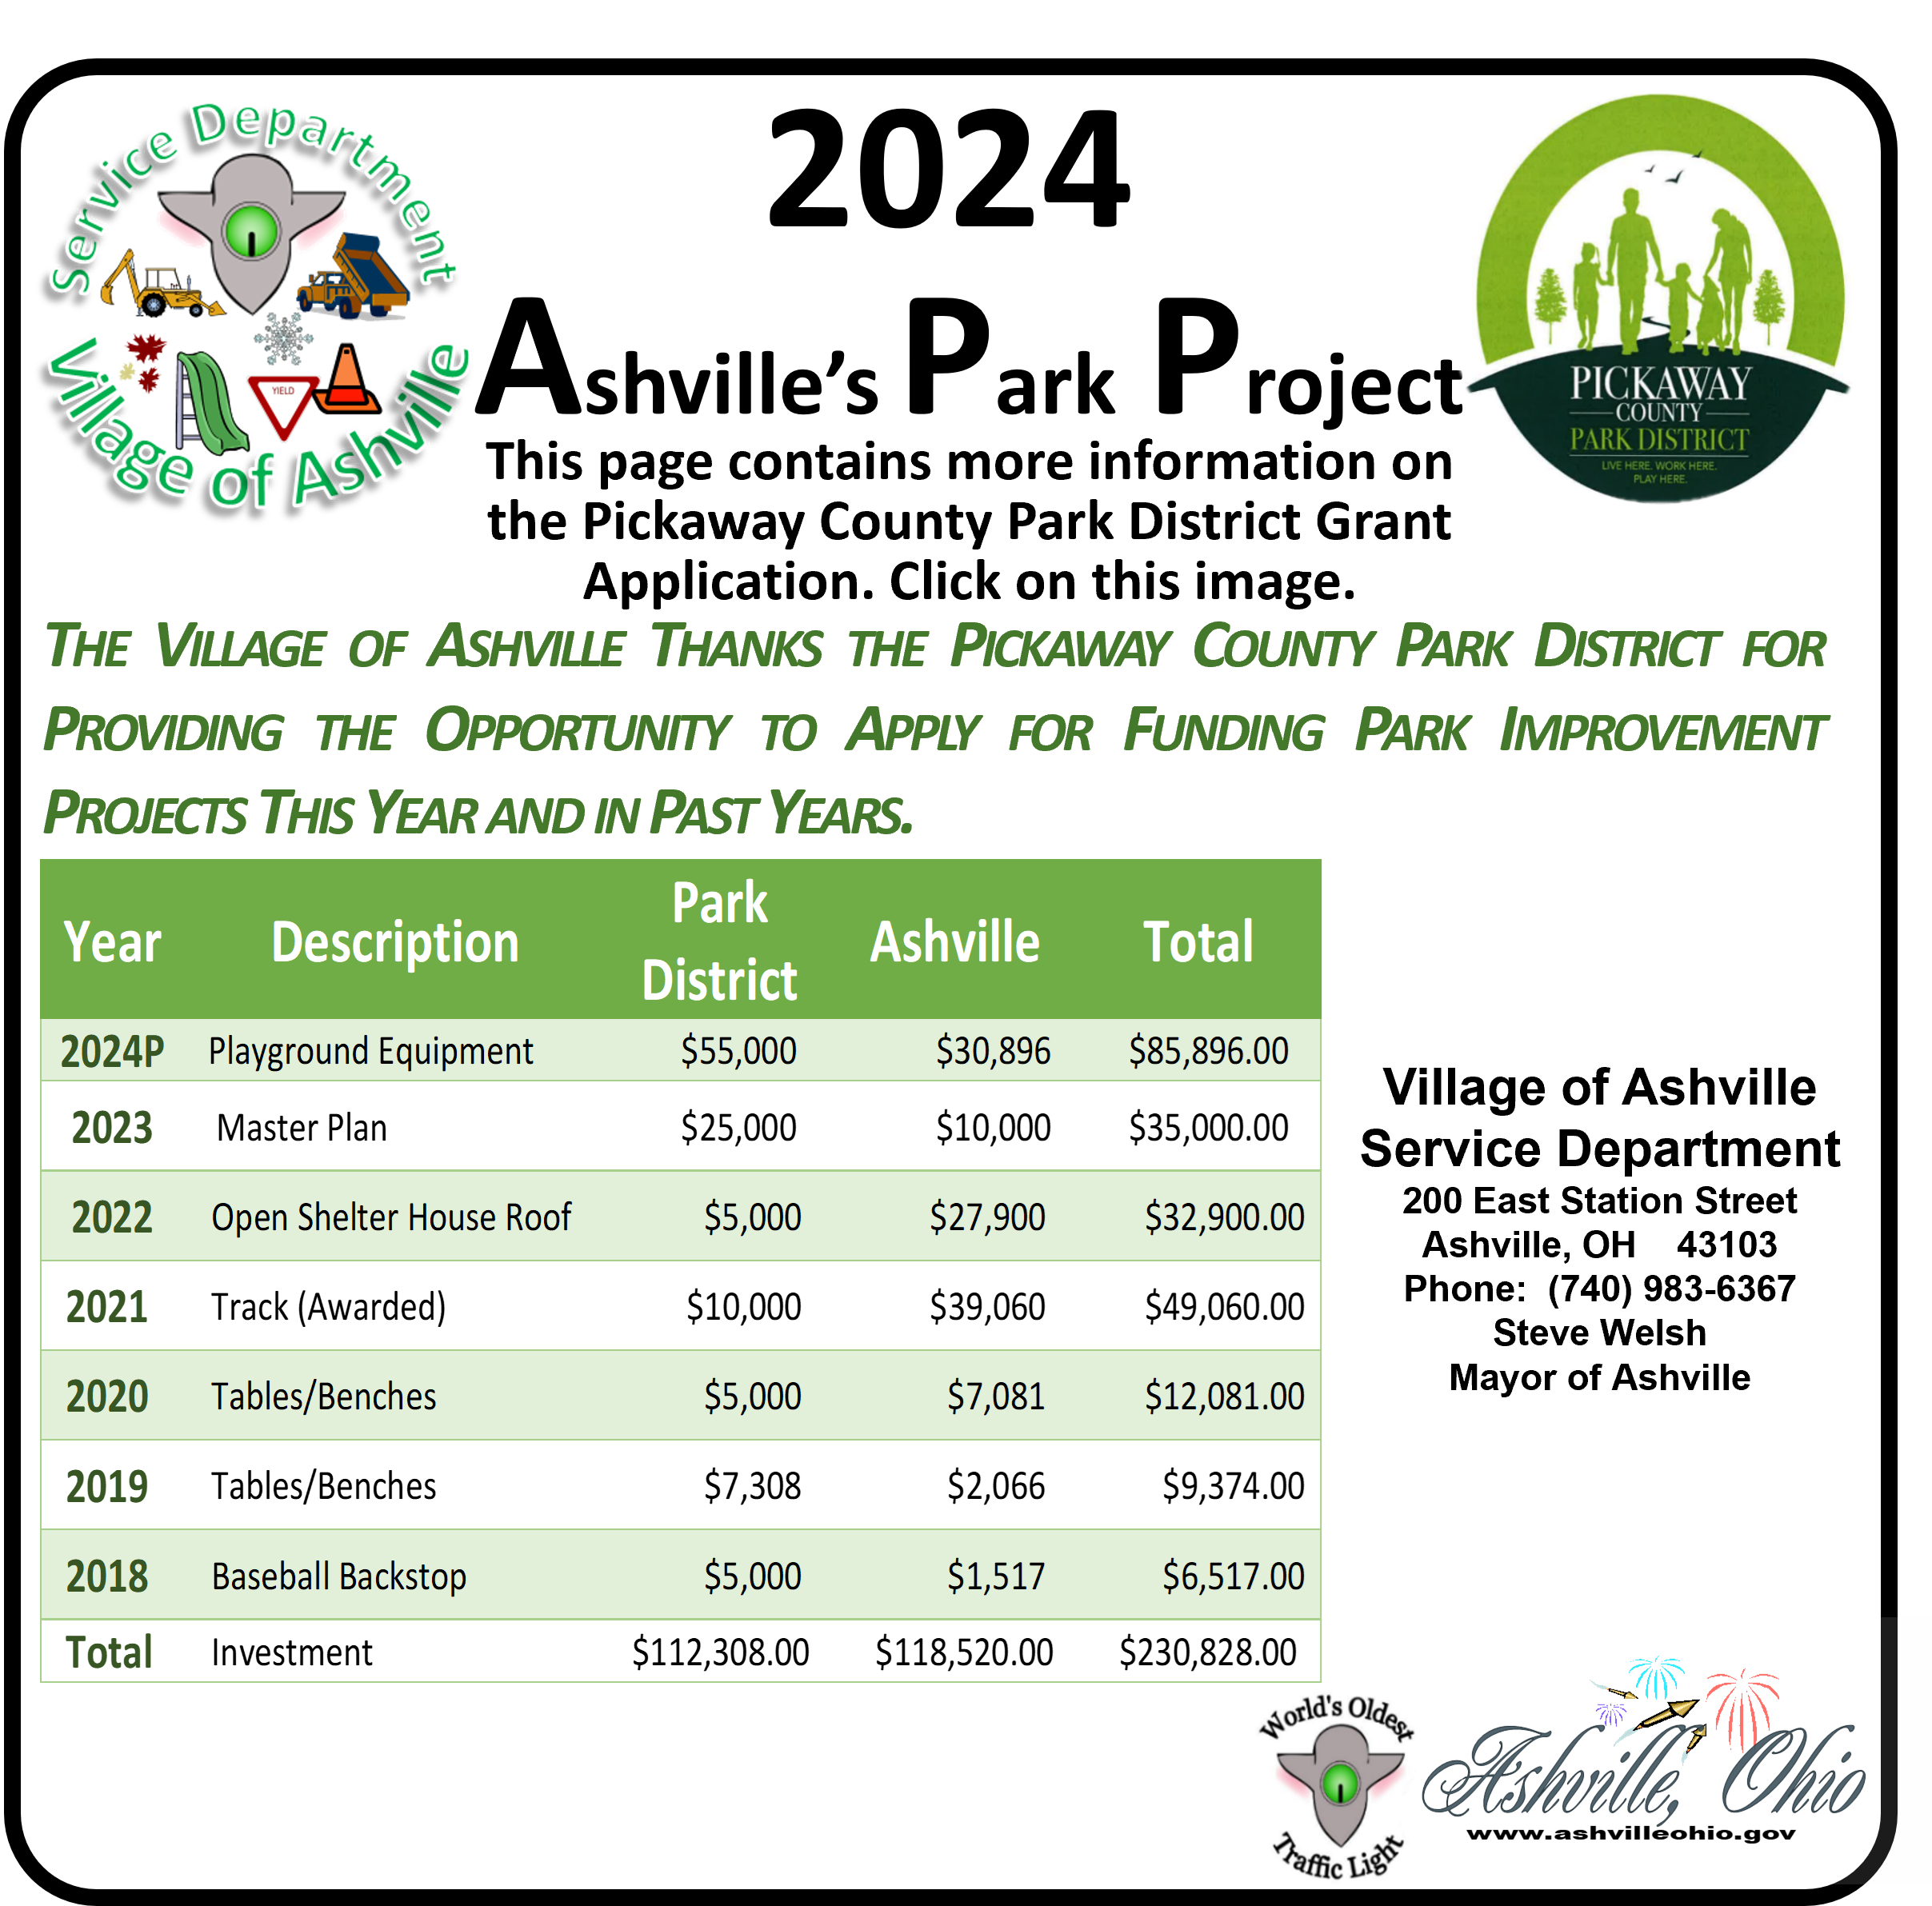
    Information on Ashville Park development can be found by clicking on the Banner or Read More. We have been fortunate to benefit from Pickaway County Park District funding. Read More
  • Pedestrian Project

    Pedestrian Project

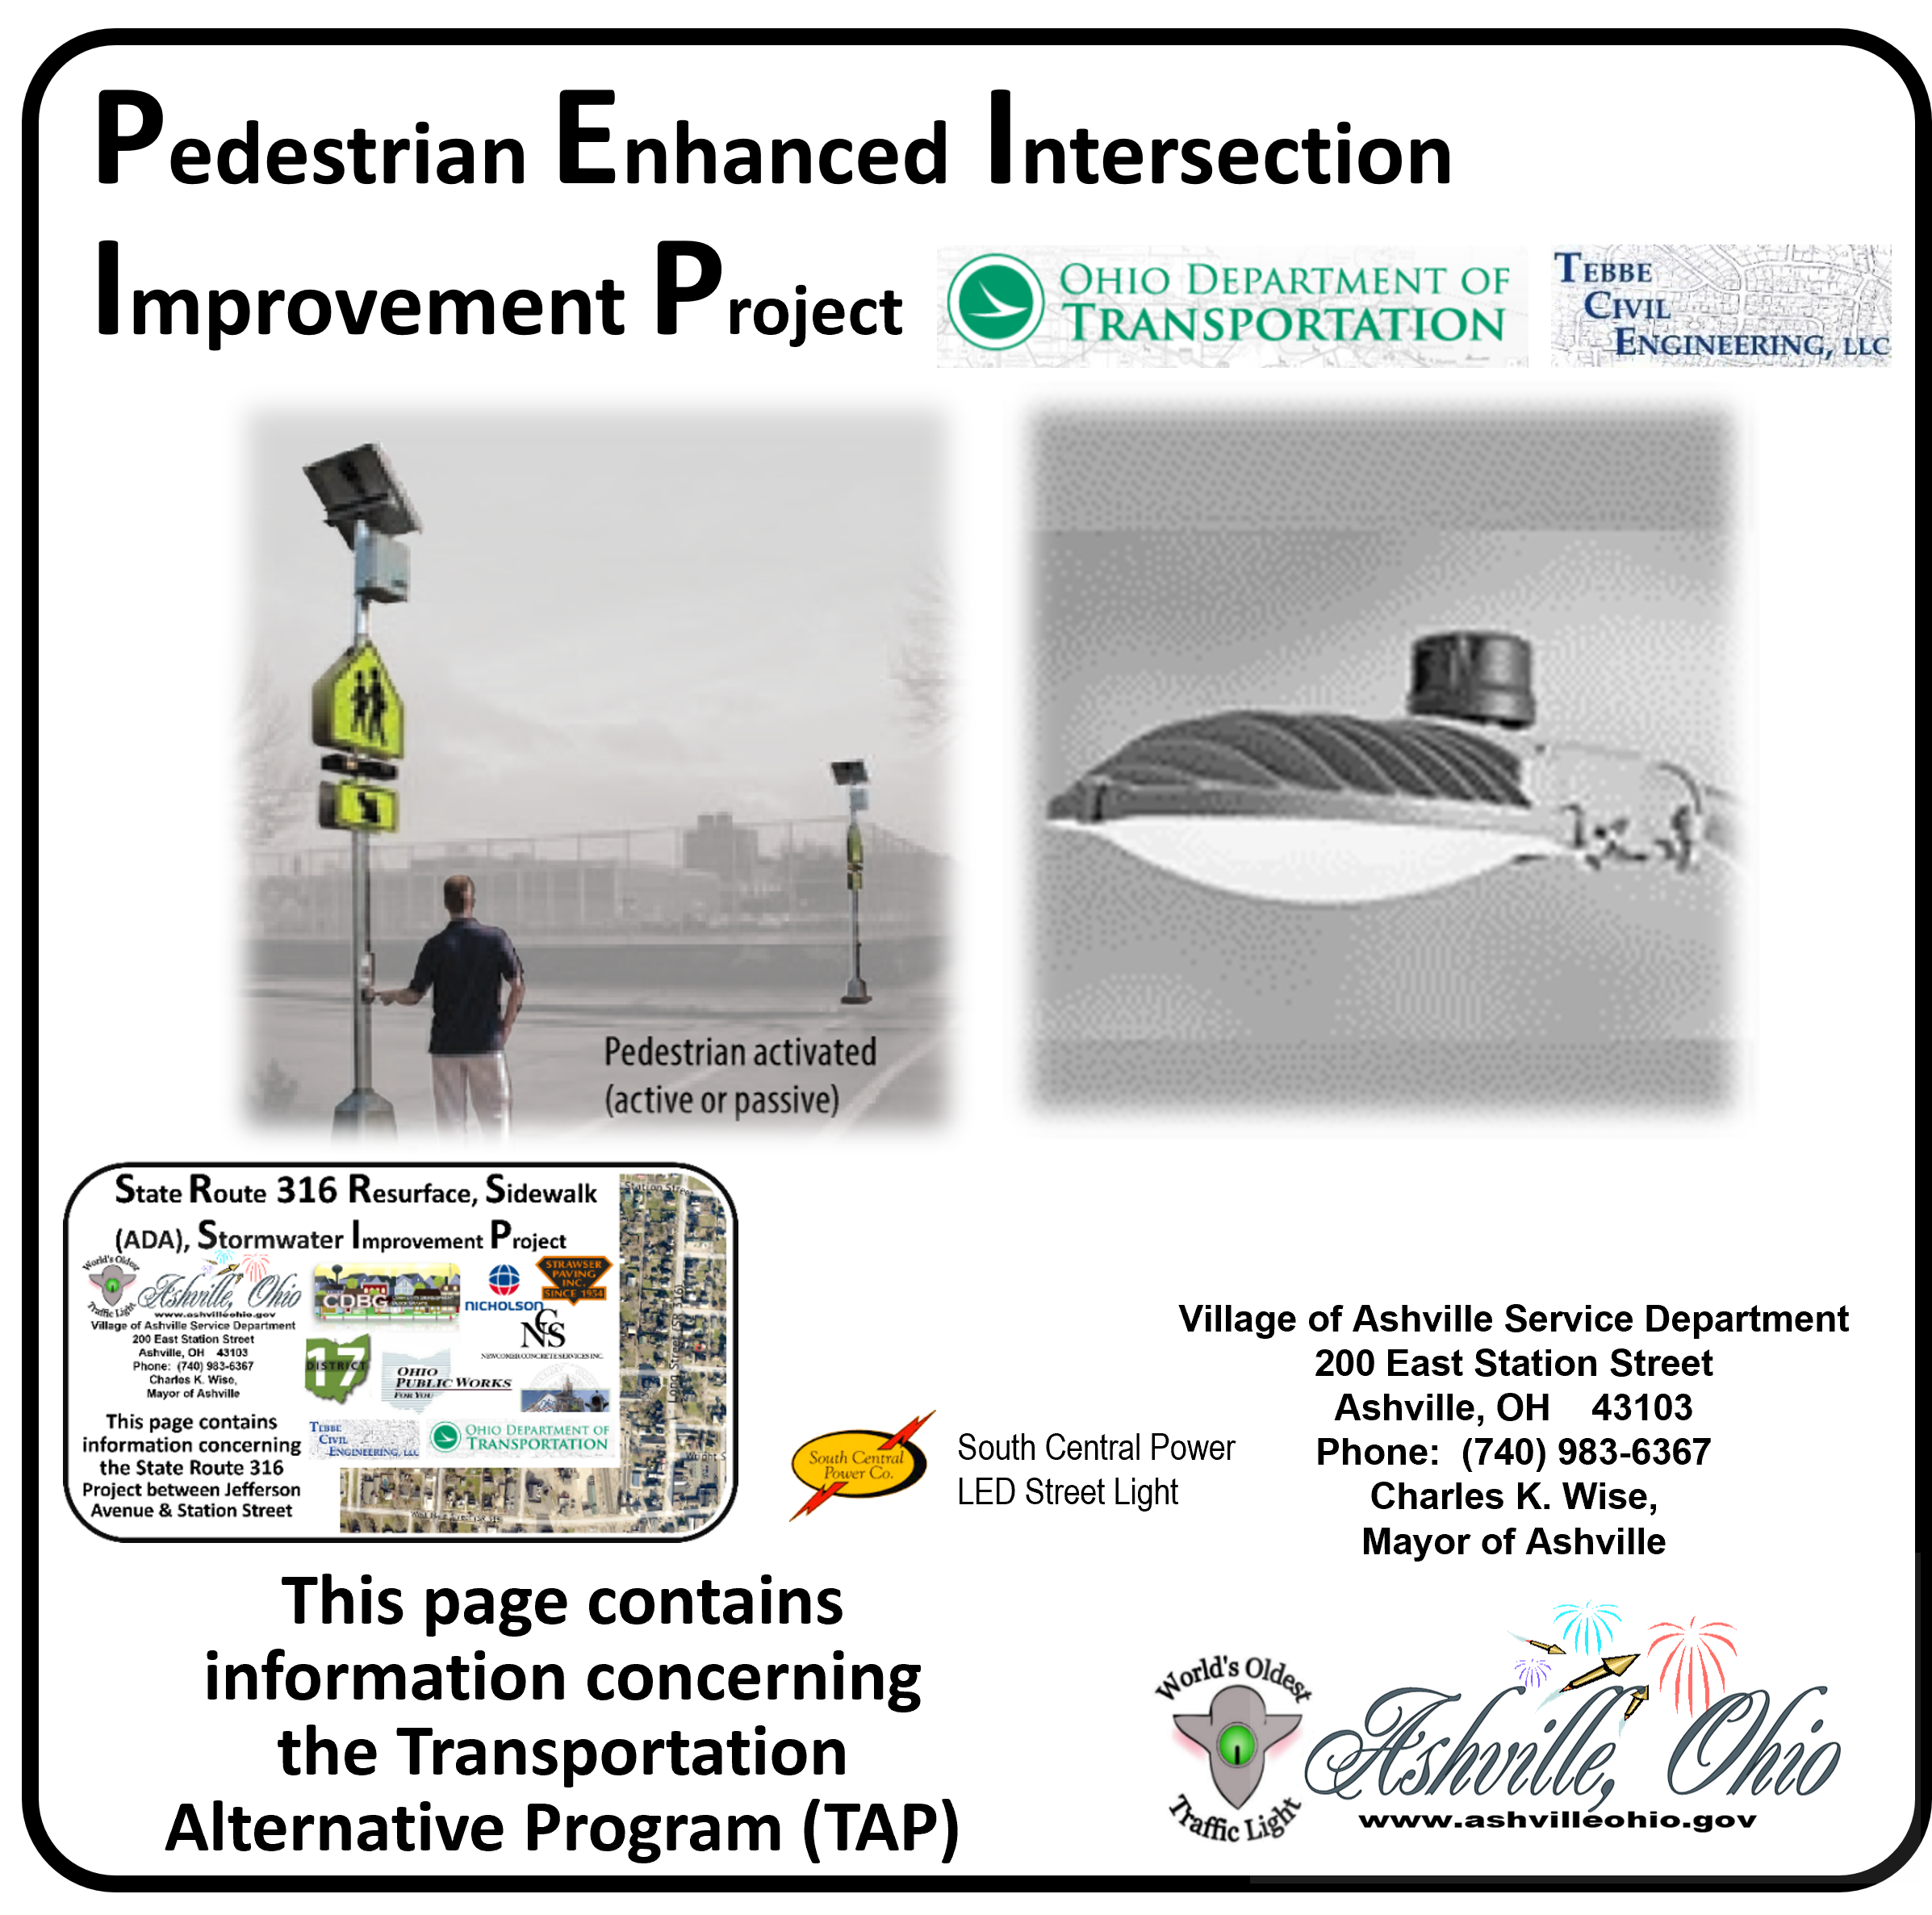
    Ashville & ODOT is funding a Pedestrian Enhanced Intersection Improvement Project. The intent is to add two (2) pedestrian signals and five (5) LED street lights. For more information click on the Banner or Read. Read More
  • South Metershed Project

    South Metershed Project

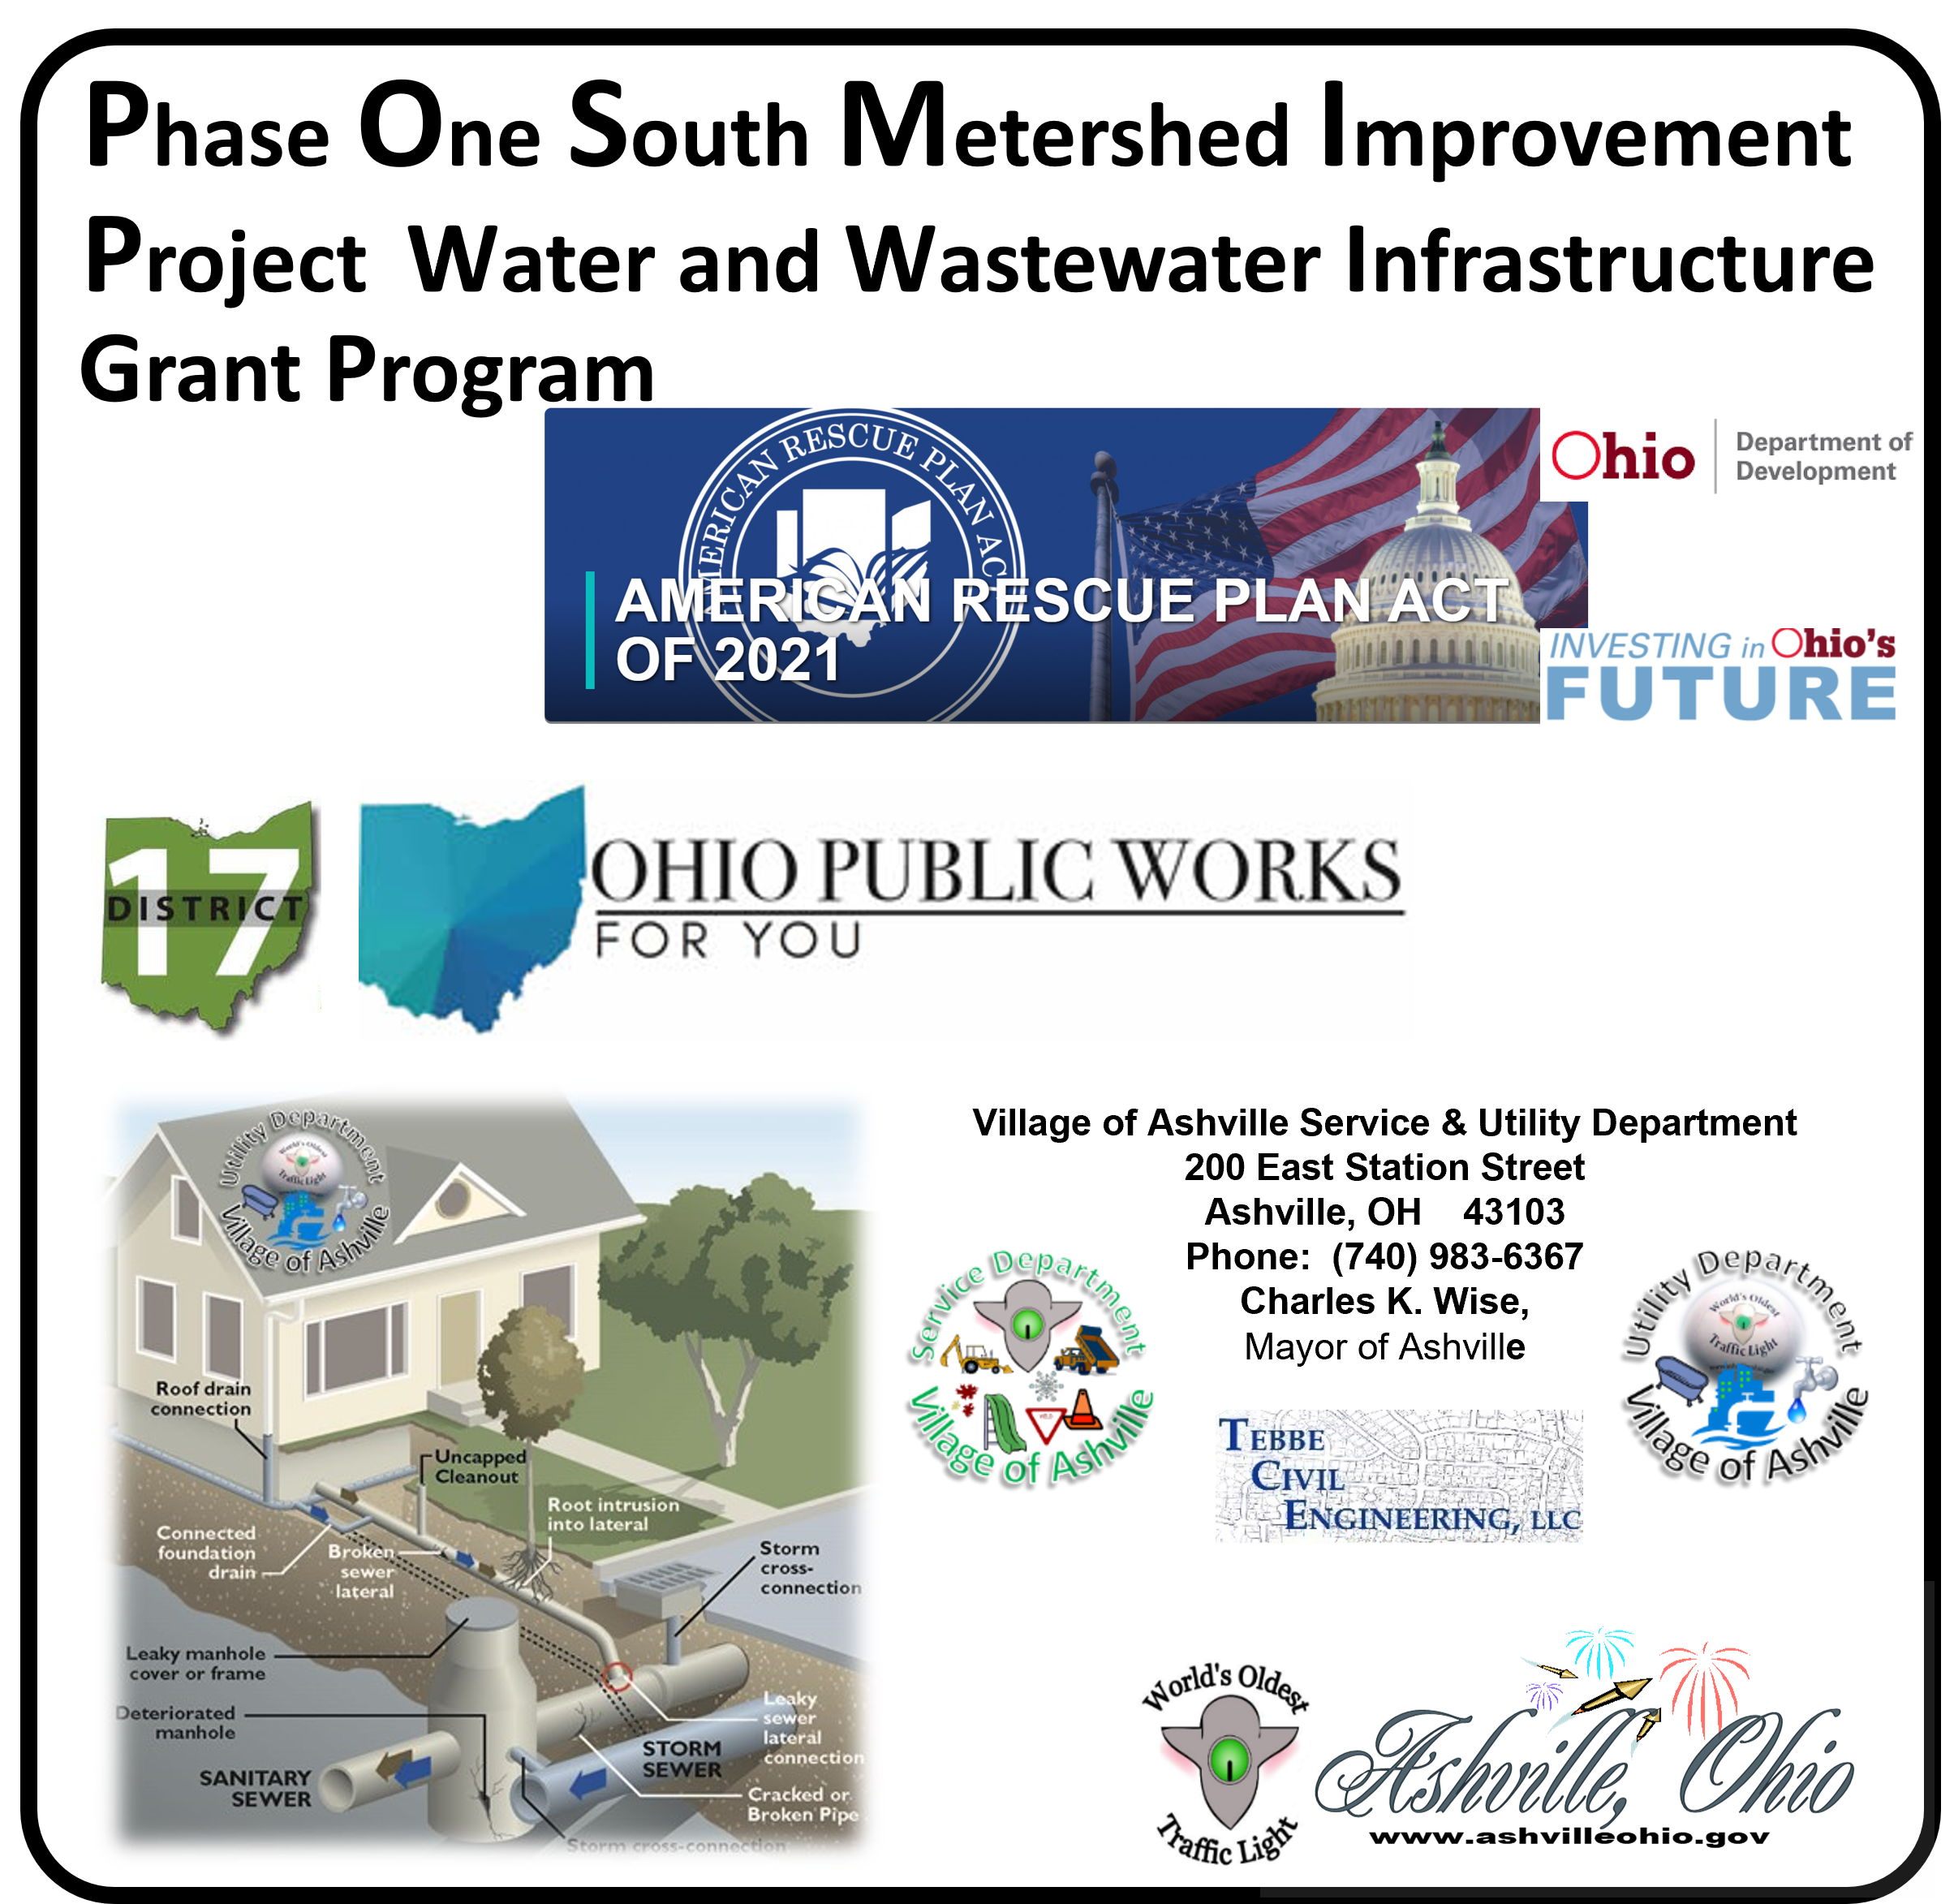
    Phase 1 of Improvement Project is funded by the Ohio Public Works Commission & the Ohio Department of Development (American Rescue Plan Act of 2021) for funding. For information click on the Banner or Read More. Read More
  • Resource Connection

    Resource Connection

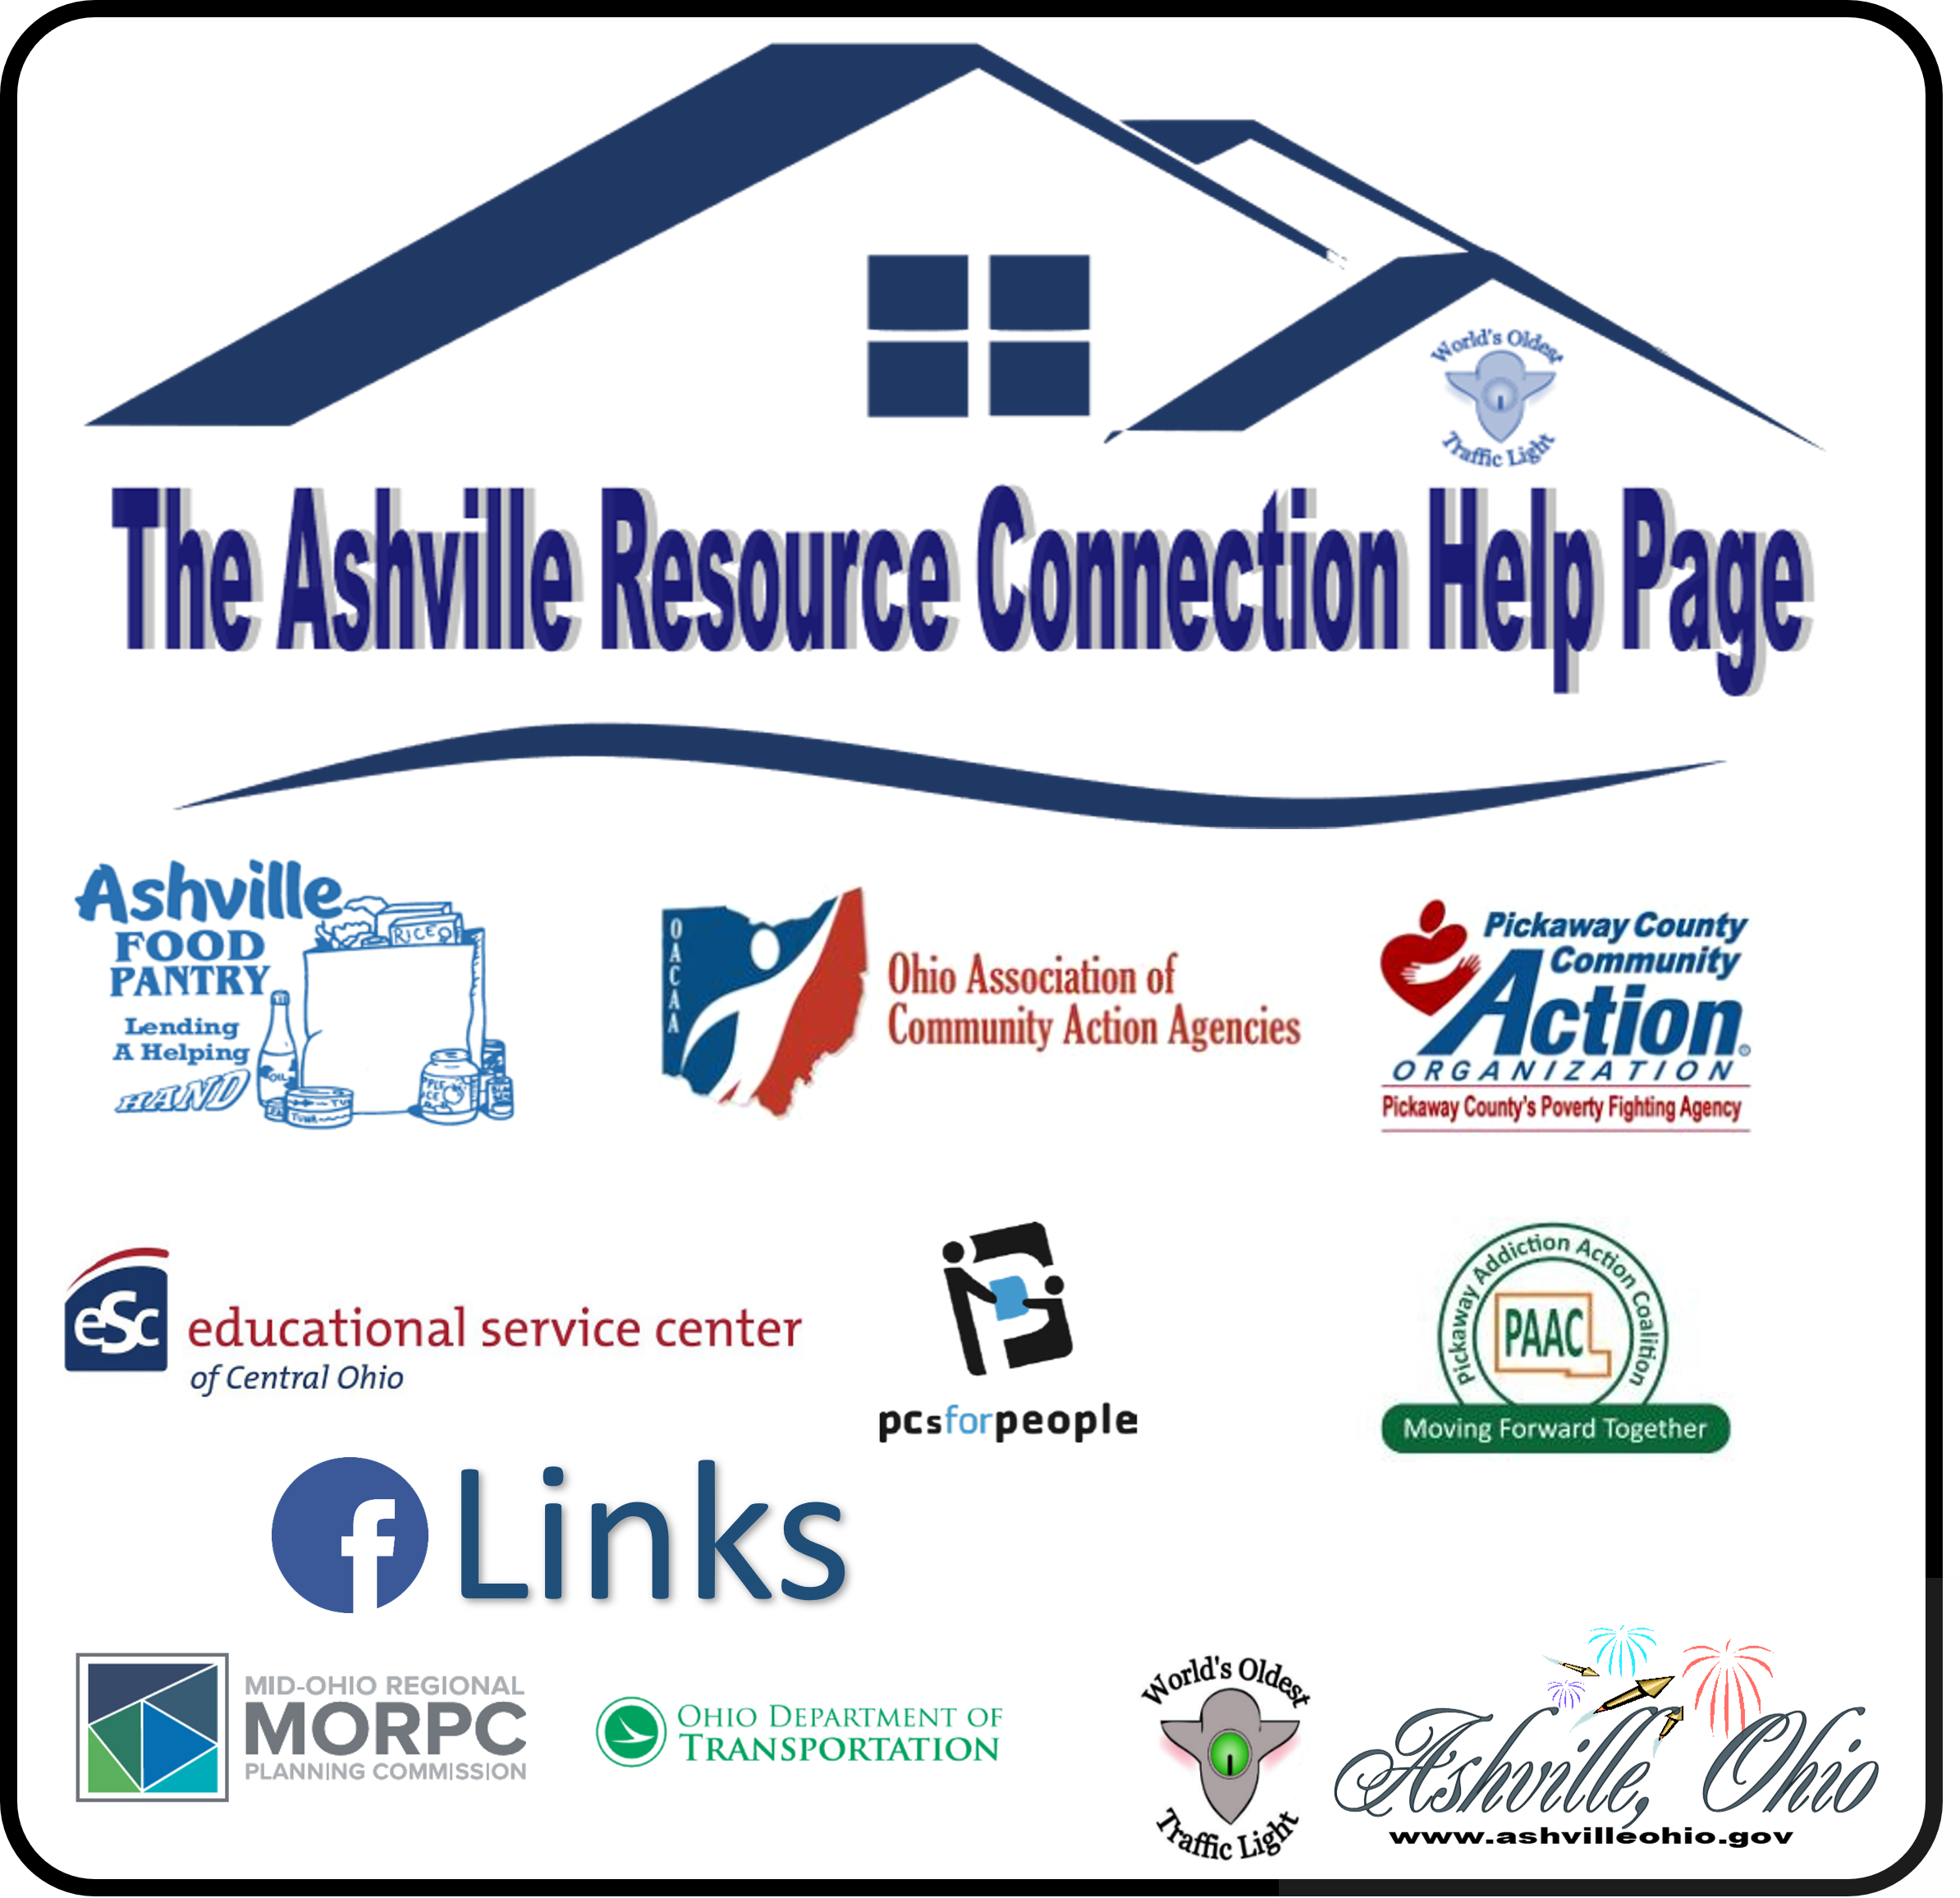
    Resource information can be found by clicking on the Banner or Read More. This information includes transportation, food, computers, & connectivity, If you have an idea or information, please let us know. Read More
  • Financial Page

    Financial Page

    Financial ReportsThese reports include the Temporary and Permanent Expense Budgets, Anticipated Sources of Revenue Budget, Annual Financial Reports of the village and other financial information. Read More
  • CCR

    CCR

    Water Quality Report is also know as the Consumer Confidence Report (CCR). You can take a look at the report (s) by clicking on the Banner/Read More. Read More
  • Gas Aggregation

    Gas Aggregation

    Gas Aggregation is through Constellation NewEnergy - Gas Division, LLC. This was authorized by Ballot Question, legislation, & contract. For those documents, updates, & past information click on the Banner or Read More. Read More
  •  Ashville Foundation

    Ashville Foundation

    The purpose is to review its history, recruit members, elect officers, and approve by-laws. We encourage you to click on the Banner or Read More to get involved. Read More
  • Reporting Potholes

    Reporting Potholes

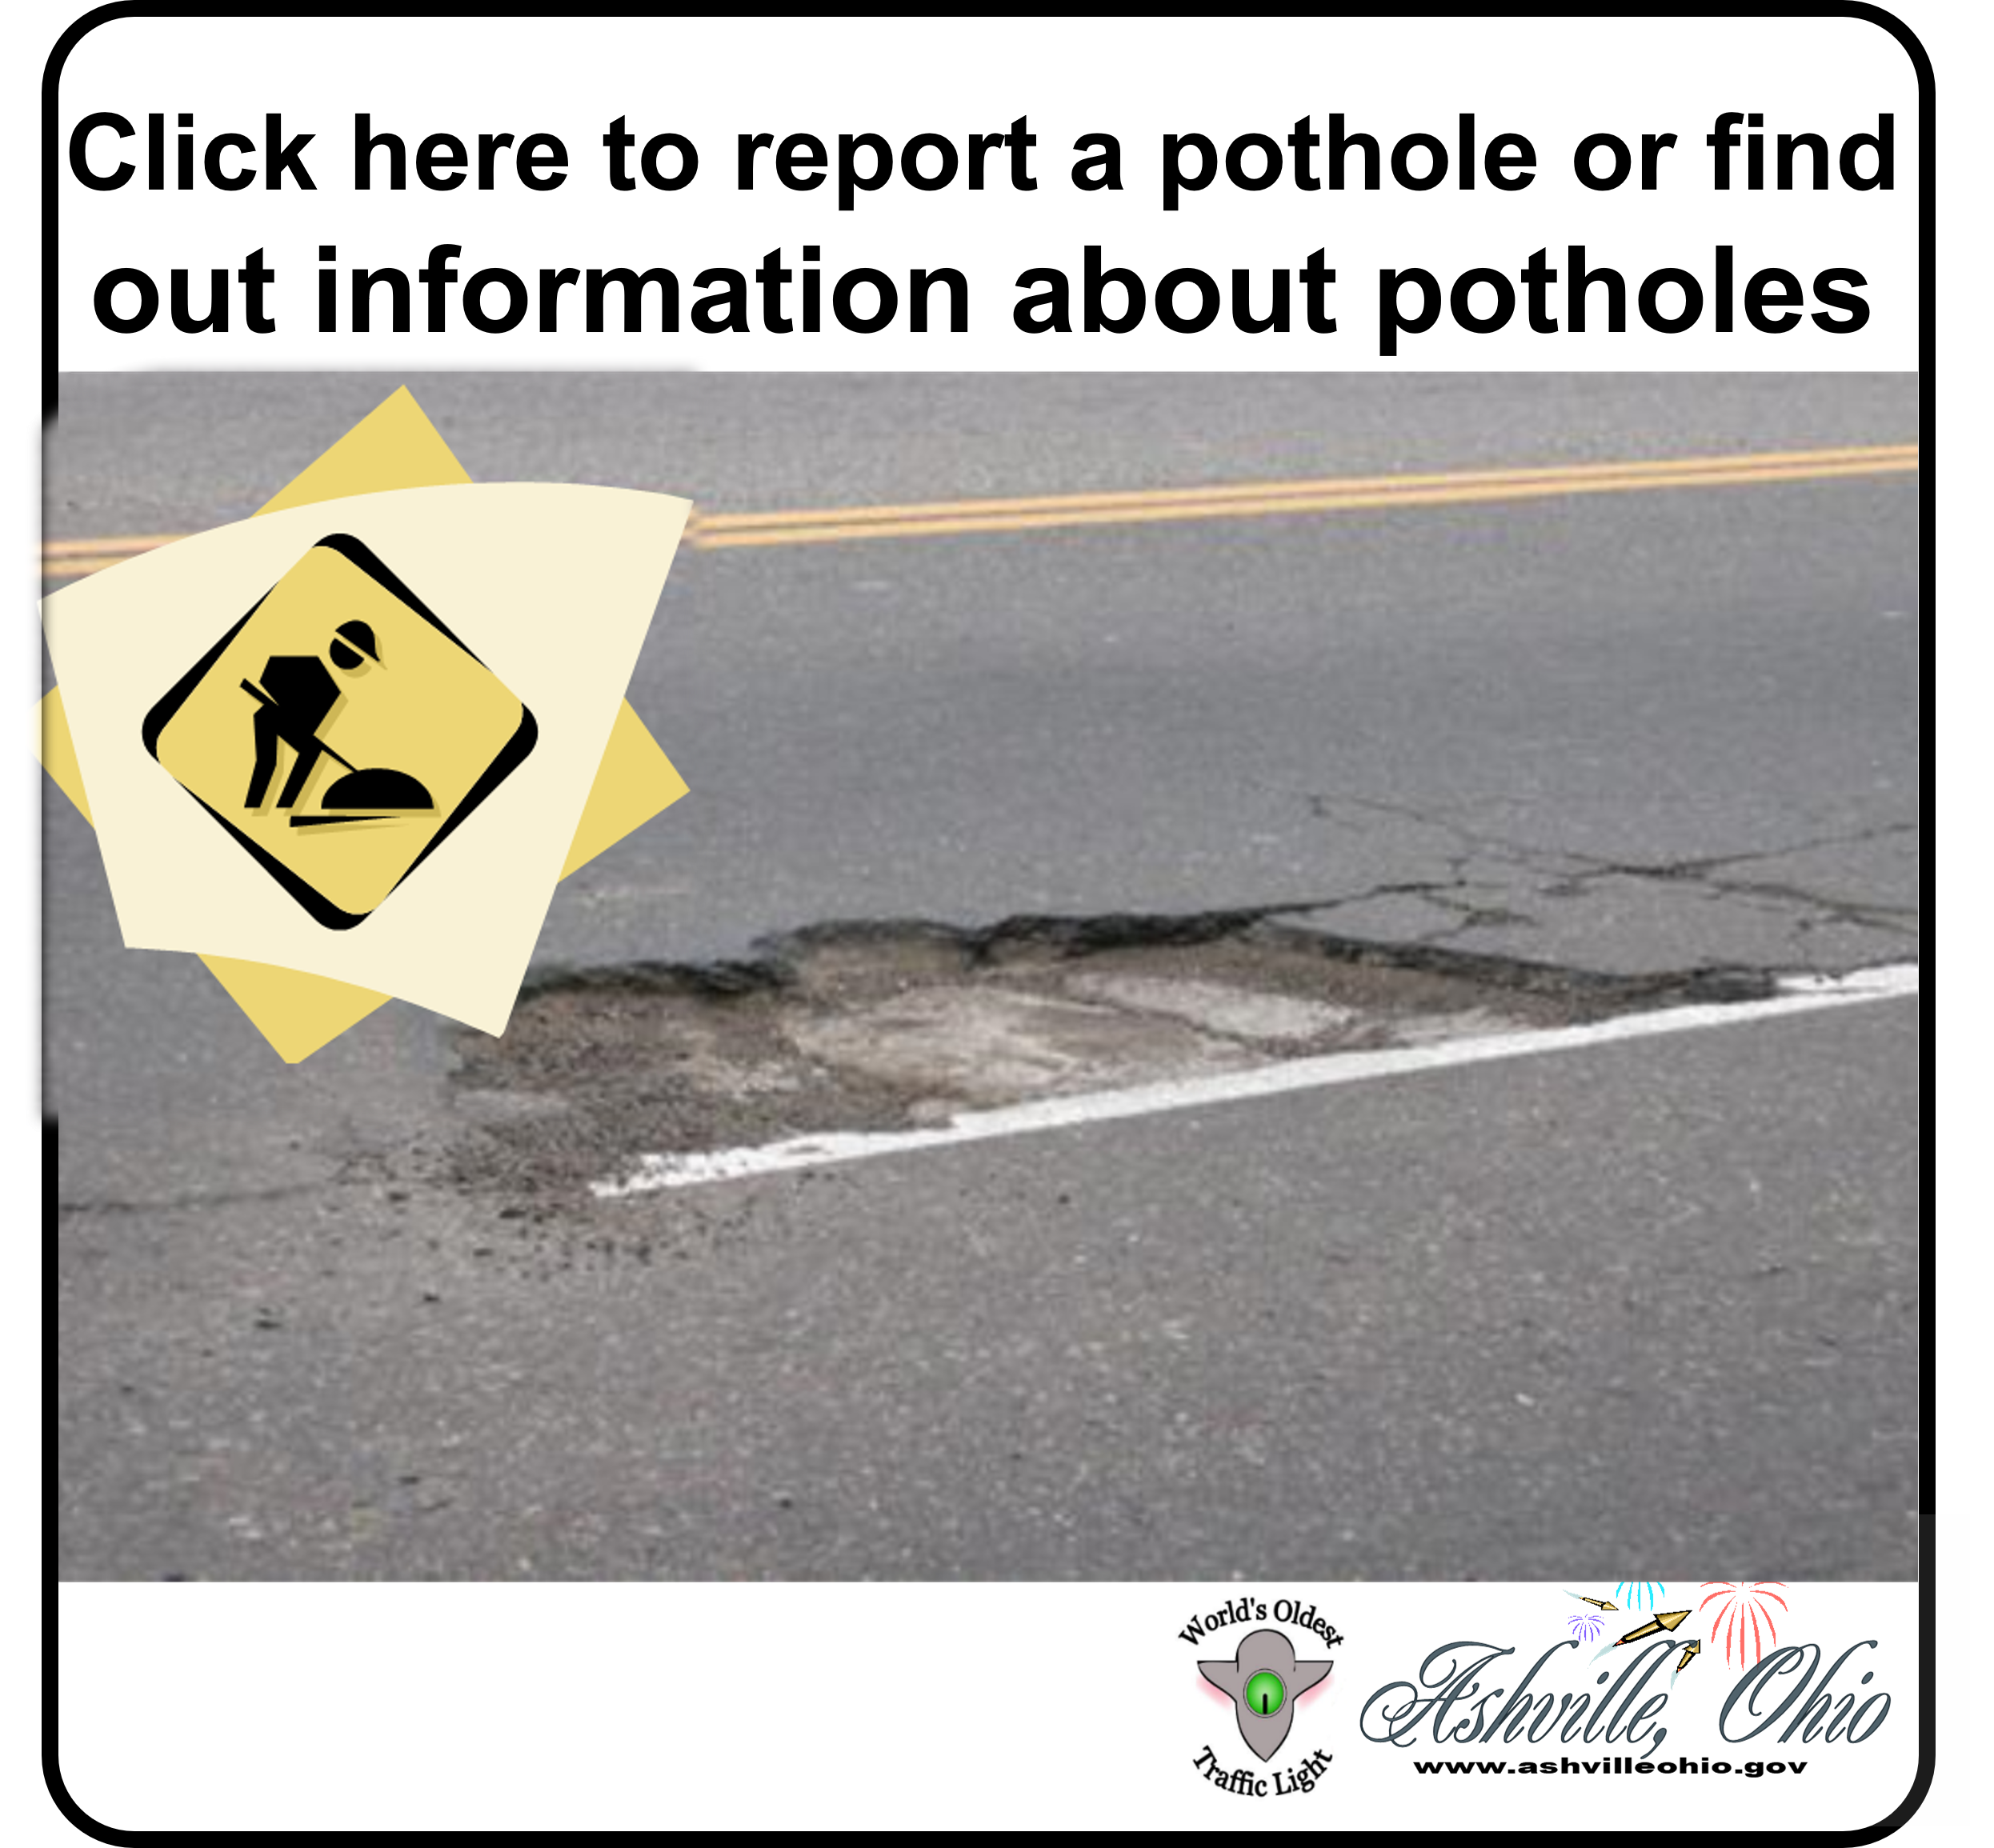
    If you see a pothole please call 740-983-6367 and report the location. To find out more about reporting potholes in Ashville, click the Banner or Read More. This will take you to our online reporting system. Read More
  • General Information

    General Information

    By clicking on this Banner or Read More you will find out more information on projects, events, and more. Read More
  • 1
  • 2
  • 3
  • 4
  • 5
  • 6
  • 7
  • 8
  • 9
  • 10
  • 11
  • 12
  • 13
  • 14
  • 15
  • 16
  • 17
  • 18
  • 19
  • 20
  • 21
  • 22

Village of Ashville, Ohio

752 viking way logo

The four items below are links. Click on the title.

January Newsletter Article concerning traffic signal at State Route 752 and Viking Way
Circleville Herald Article Concerning Traffic Signal
Ohio Department of Transportation (ODOT)
ODOT Traffic Signal Policy

Message from ODOT:

The traffic counts have been processed to determine if a signal is warranted at the SR-752/Lockbourne Eastern intersection. The counts and warrant analysis are attached to this email. This information shows that a traffic signal is not warranted at this intersection. From the feedback I have received on the current  4-way stop condition it is working well. I recommend that we meet again in three to six months to review any issues that may develop and determine how to move forward. Feel free to contact me if you would like to discuss this further.

David Carlin, P.E. ODOT, District 6, 400 E. William Street, Delaware, Ohio 43015, 740-833-8345

The analysis and data can be accessed by clicking on the names below:

Warrant Analysis
Traffic Data       

A traffic signal can improve safety and reduce delay for users of the intersection, or a traffic signal can increase the number of crashes and cause excessive delay.  For a traffic signal to have a positive effect, it must be properly located and maintained. Traffic Signal Warrants exist to provide minimum qualifications for installing a traffic signal.  Adhering to these minimum qualifications prevents many traffic signals from being installed where they would have a negative impact.

As mentioned above, these Warrants are minimum qualifications, and satisfaction of one or more warrants does not require the installation of a traffic signal.  The criteria for the nine Traffic Signal Warrants take into consideration traffic volumes, pedestrians, school crossings, crash experience, and traffic signal networks. Click here for a brief description of the Traffic Signal Warrants. Engineering judgment by a professional engineer should be the final determining factor in deciding if a traffic signal should be installed.

Every three to five years, existing traffic signals should be evaluated to determine if they are still justified.  Traffic conditions can and will change, sometimes making another form of intersection control, such as stop signs, safer and more efficient.  If a traffic signal is considered for removal, a lengthy study process will be initiated to ensure that removing the traffic signal will be an improvement and will not jeopardize the safety of the intersection.

District 7 has created procedures to evaluate the need for traffic signals.  The intention is to clarify and streamline the processes to improve efficiency and consistency.  Links to these procedures are available below.  A link has also been included that contains information and forms relating specifically to traffic signals located on state routes in villages.

For more information, the Ohio Manual of Uniform Traffic Control Devices (OMUTCD) and the Traffic Engineering Manual (TEM) can be accessed online at www.dot.state.oh.us under the Design Reference Resource Center. These manuals are the primary source of the information in this policy.  The Office of Traffic Engineering also has a website of Frequently Asked Questions for Traffic Signals.  ODOT’s policy for the installation of traffic signals and beacons on state highways (Policy 516-002) can also be accessed online.

Further inquiries should be directed to Craig Eley, P.E., District 7 Traffic Engineer.  He can be contacted by phone at (937) 497-6832 or by email at This email address is being protected from spambots. You need JavaScript enabled to view it.

http://www.dot.state.oh.us/districts/D07/traffic/Pages/TrafficPolicy.aspx

Determining Need for Traffic Signal control

The following is from the 2012 edition of the Ohio Manual of Uniform Traffic Control Devices.

CHAPTER 4C.  TRAFFIC CONTROL SIGNAL NEEDS STUDIES

Section 4C.01  Studies and Factors for Justifying Traffic Control Signals

Standard:

    An engineering study of traffic conditions, pedestrian characteristics, and physical characteristics of the location shall be performed to determine whether installation of a traffic control signal is justified at a particular location.

    The investigation of the need for a traffic control signal shall include an analysis of the applicable factors contained in the following traffic signal warrants and other factors related to existing operation and safety at the study location:

    Warrant 1, Eight-Hour Vehicular Volume.

    Warrant 2, Four-Hour Vehicular Volume.

    Warrant 3, Peak Hour.

    Warrant 4, Pedestrian Volume.

    Warrant 5, School Crossing.

    Warrant 6, Coordinated Signal System.

    Warrant 7, Crash Experience.

    Warrant 8, Roadway Network.

    Warrant 9, Intersection Near a Grade Separation.

    The satisfaction of a traffic signal warrant or warrants shall not in itself require the installation of a traffic control signal.

Support:

    Sections 8D.07 and 10D.05 contain information regarding the use of traffic control signals instead of gates and/or flashing light signals at highway-railroad grade crossings and highway light rail transit grade crossings, respectively.

Guidance:

    A traffic control signal should not be installed unless one or more of the factors described in this Chapter are met.

    A traffic control signal should not be installed unless an engineering study indicates that installing a traffic control signal will improve the overall safety and/or operation of the intersection.

    A traffic control signal should not be installed if it will seriously disrupt progressive traffic flow.

    The study should consider the effects of the right-turn vehicles from the minor-street approaches.  Engineering judgment should be used to determine what, if any, portion of the right-turn traffic is subtracted from the minor-street traffic count when evaluating the count against the above signal warrants.

    Engineering judgment should also be used in applying various traffic signal warrants to cases where approaches consist of one lane plus one left-turn or right-turn lane. The site-specific traffic characteristics should dictate whether an approach is considered as one lane or two lanes. For example, for an approach with one lane for through and right-turning traffic plus a left-turn lane, if engineering judgment indicates that it should be considered a one-lane approach because the traffic using the left-turn lane is minor, the total traffic volume approaching the intersection should be applied against the signal warrants as a one-lane approach. The approach should be considered two lanes if approximately half of the traffic on the approach turns left and the left-turn lane is of sufficient length to accommodate all left-turn vehicles.  

    Similar engineering judgment and rationale should be applied to a street approach with one through/left-turn lane plus a right-turn lane. In this case, the degree of conflict of minor-street right-turn traffic with traffic on the major street should be considered. Thus, right-turn traffic should not be included in the minor-street volume if the movement enters the major street with minimal conflict. The approach should be evaluated as a one-lane approach with only the traffic volume in the through/left-turn lane considered.     
    At a location that is under development or construction and where it is not possible to obtain a traffic count that would represent future traffic conditions, hourly volumes should be estimated as part of an engineering study for comparison with traffic signal warrants. Except for locations where the engineering study uses the satisfaction of Warrant 8 to justify a signal, a traffic control signal installed under projected conditions should have an engineering study done within 1 year of putting the signal into stop-and-go operation to determine if the signal is justified. If not justified, the signal should be taken out of stop-and-go operation or removed.
 

    For signal warrant analysis, a location with a wide median, even if the median width is greater than 30 feet, should be considered as one intersection.  

Option:

    At an intersection with a high volume of left-turn traffic from the major street, the signal warrant analysis may be performed in a manner that considers the higher of the major-street left-turn volumes as the ―minor-street‖ volume and the corresponding single direction of opposing traffic on the major street as the ―major-street‖ volume.

    For signal warrants requiring conditions to be present for a certain number of hours in order to be satisfied, any four sequential 15-minute periods may be considered as 1 hour if the separate 1-hour periods used in the warrant analysis do not overlap each other and both the major-street volume and the minor-street volume are for the same specific one-hour periods.

    For signal warrant analysis, bicyclists may be counted as either vehicles or pedestrians.

Support:

    When performing a signal warrant analysis, bicyclists riding in the street with other vehicular traffic are usually counted as vehicles and bicyclists who are clearly using pedestrian facilities are usually counted as pedestrians.

Option:

      Engineering study data may include the following:

    The number of vehicles entering the intersection in each hour from each approach during 12 hours of an average day.  It is desirable that the hours selected contain the greatest percentage of the 24-hour traffic volume.
    Vehicular volumes for each traffic movement from each approach, classified by vehicle type (heavy trucks, passenger cars and light trucks, public-transit vehicles, and, in some locations, bicycles), during each 15-minute period of the 2 hours in the morning and 2 hours in the afternoon during which total traffic entering the intersection is greatest.
    Pedestrian volume counts on each crosswalk during the same periods as the vehicular counts in Item B and during hours of highest pedestrian volume. Where young, elderly, and/or persons with physical or visual disabilities need special consideration, the pedestrians and their crossing times may be classified by general observation.  
    Information about nearby facilities and activity centers that serve the young, elderly, and/or persons with disabilities, including requests from persons with disabilities for accessible crossing improvements at the location under study.  These persons may not be adequately reflected in the pedestrian volume count if the absence of a signal restrains their mobility.
    The posted or statutory speed limit or the 85th-percentile speed on the uncontrolled approaches to the location.
    A condition diagram showing details of the physical layout, including such features as intersection geometrics, channelization, grades, sight-distance restrictions, transit stops and routes, parking conditions, pavement markings, roadway lighting, driveways, nearby  railroad crossings, distance to nearest traffic control signals, utility poles and fixtures, and adjacent land use.
    A collision diagram showing crash experience by type, location, direction of movement, severity, weather, time of day, date, and day of week for at least 1 year.

The following data, which are desirable for a more precise understanding of the operation of the intersection, may be obtained during the periods specified in Item B of paragraph 17:

    Vehicle-hours of stopped time delay determined separately for each approach.
    The number and distribution of acceptable gaps in vehicular traffic on the major street for entrance from the minor street.
    The posted or statutory speed limit or the 85th-percentile speed on controlled approaches at a point near to the intersection but unaffected by the control.
    Pedestrian delay time for at least two 30-minute peak pedestrian delay periods of an average weekday or like periods of a Saturday or Sunday.
    Queue length on stop-controlled approaches.

Additional information on traffic signals

Advantages and Disadvantages of Traffic Signals - This page links other pages with information on the subject of traffic signals.

Installation of Traffic Control Signals and Intersection Control Beacons on State Highways
ODOT Policy No: 516-002(P)     (requires Adobe Acrobat Reader)

ODOT District One Planning & Engineering Web Site Manager:  Charles Schreck

The Ohio Department of Transportation, 1980 West Broad Street, Columbus Ohio 43223
John R. Kasich, Governor | Jerry Wray, ODOT Director | Privacy Statement | Advanced Search | Feedback | Ohio.gov

http://www.dot.state.oh.us/districts/D01/PlanningPrograms/trafficstudies/Pages/SignalNeedsStudy.aspx


 2 tank
Ohio Environmental Protect Division of Drinking & Ground Waters

July  2014 Village  of  Ashville  Water  Department Report

3 drinking water

Ashville Newsletter. Annually we include in our newsletter a report on the quality of water provided to our residents. The Ohio Environmental Protection Agency (O-EPA) calls this the CCR or Consumer Confidence Report. All community public water systems are required to prepare a CCR annually and distribute the report to their customers. The report contains information on the community’s drinking water including the source of the water, contaminants detected, the likely sources of detected contaminants, health effects of the contaminants when violations occur, and availability of source water assessments.

CCR’s are required by the 1996 amendments to the Safe Drinking Water Act. The Federal Rule (40 CFR 141.151 through 155) was finalized August 19, 1998. We hope this information will provide you comfort and security. We recognize that water quality is a very important area of operation.

The Village of Ashville pumped 207.148 million gallons in 2013 with 23.295 removed in the process resulting in total finished pumped or 183.853 MG.

A Word from the Water Departmentwelsh

In 2013 we implemented our backflow cross contamination program. Many inspections have been completed and those inspected have come into full compliance. Not only have we transitioned into a new mind-set of protecting our system, but in the process have been able to  help  businesses  and residents identify problems within their own systems. We have found leaks and plumbing issues that had gone unnoticed by owners and identified potential problems, assisting and advising on how to correct these problems. The backflow information program is on the Village of Ashville website, www.ashvilleohio.gov, which makes it easier to get forms and also answer questions about what backflow means, and what all is involved.

The program is ongoing with continued efforts to improve the process. So far, I would say the program has been a success.  In anticipation of the future and in an effort to provide more reliable information on what our system is doing and what our demands are, we continue to install radio read meters, in addition to replacing some of our larger meters.


Introduction6 intro

The Ashville Water Department is pleased to provide you with this year’s Consumer Confidence Report. We want to keep you informed about the excellent water and services we have delivered to you over the past year. Our goal is, and has always been, to provide you a safe and dependable supply of drinking water. The treatment facility is located at 140 Park Street. The water treatment facility removes iron and manganese by oxidation and filtration. The filtered water is softened using an ion-exchange process. The softened water is disinfected with chlorine prior to distribution to our customer. The Village of Ashville’s Water Department has prepared the following report to provide information to you, the consumer, on the quality of our drinking water.  Included within this report is general health information, water quality test results, how to participate in decisions concerning your drinking water and water system contacts.

We have been fortunate to have very few interruptions over the last year in our distribution system, such as large breaks resulting in loss of service.  Last year we also installed a new chorine feed system and overhauled our storage room.  New tanks, ventilation, and piping were installed with an outside bulk feed line.  These improvements make the delivery of chlorine significantly safer and more convenient.

Our water plant is turning 80-years old this year and,  although  improve-

ments and additions have been made over the years, we continue to use the oldest part of the plant every day, notably without any violations or problems meeting demand.  Although 2013 brought some changes and challenges, we worked through them all together.    Over the last year I have taken a proactive role in improving customer service and relations, and will continue this effort in the years to come.

If you have any questions, do not hesitate to contact me.

Thank you for your time.


Source Water Information and Its Projection

7 water source

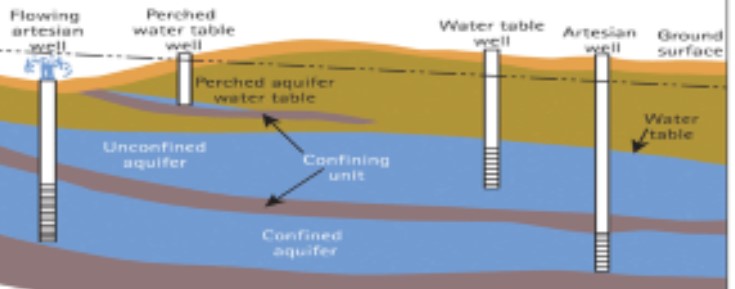
The Village of Ashville’s Water Department receives its drinking water from two (2) wells located at the village-owned and operated facility. A third (3rd) well is located south of the village on Viking Way. These wells obtain raw water from the Teays Valley Aquifer.  Aquifers are porous underground formations (such as sand or gravel) that are saturated with water.

 The SWAP can be found at http://wwwapp.epa.ohio.gov/gis/swpa/OH6500012.pdf 


How are these sources protected?5 epa standard for water

The Ohio Environmental Protection Agency has developed a program called Ohio's Source Water Assessment and Protection (SWAP) which is designed to protect our sources of drinking water. Through this program, the Ohio EPA has endorsed “the Delineation and Potential Contaminant Source Inventory components of the Village of Ashville’s drinking water source protection plan as meeting the requirements of the Ohio Wellhead Protection and Source Water Assessment and Protection Programs”.  According to this study, the aquifer (water-rich zone) that supplies water to the Village of Ashville has a high susceptibility to contamination.  This determination is based on the following:

  • presence of a relatively thin protective layer of clay/shale/other overlying the aquifer,
  • shallow depth (less than 50 feet below ground surface) of the uppermost aquifer, and
  • presence of significant potential contaminant sources in the protection area.

This susceptibility means that under currently existing conditions, the likelihood of the aquifer becoming contaminated is relatively high.  This likelihood can be minimized by implementing appropriate protective measures. More specifically this report identified seven (7) potential significant sources of contamination within the one year capture zones. They include: (1)sanitary sewer lines, (2,3,4) source wells, (5)natural gas line, (6) Ashville Park, and (7) municipal road maintenance. More information about the source water assessment or what consumers can do to help protect the aquifer is available by calling Tom Bouts, Jim Welsh, or Franklin Christman at 740-983-6367.


Special Precaution Needs8 special needs

Some people may be more vulnerable to contaminants in drinking water than the general population.  Immuno-compromised persons such as persons with cancer undergoing chemotherapy, persons who have undergone organ transplants, people with HIV/AIDS or other immune system disorders, some elderly, and infants can be particularly at risk from infection.  These people should seek advice about drinking water from their health care providers.  EPA/CDC guidelines on appropriate means to lessen the risk of infection by Cryptosporidium and other microbial contaminants are available from the Safe Drinking Water Hotline (1-800-426-4791).


What are sources of contamination to drinking water?

The sources of drinking water, both tap water and bottled water, include rivers, lakes, streams, ponds, reservoirs, springs, and wells.  As water travels over the surface of the land or through the ground, it dissolves naturally-occurring minerals and, in some cases, radioactive material, and can pick up substances resulting from the presence of animals or from human activity.

Contaminants that may be present in source water include: (A) Microbial contaminants, such as viruses and bacteria, which may come from sewage treatment plants, septic systems, agricultural livestock operations and wildlife; (B) Inorganic contaminants, such as salts and metals, which can be naturally-occurring or result from urban storm water runoff, industrial or domestic wastewater discharges, oil and gas production, mining, or farming; (C) Pesticides and herbicides, which may come from a variety of sources such as agriculture, urban storm water runoff, and residential uses; (D) Organic chemical contaminants, including synthetic and volatile organic chemicals, which are by-products of industrial processes and petroleum production, and can also come from gas stations, urban Strom water runoff, and septic systems; (E) Radioactive contaminants, which can be naturally-occurring or be the result of oil and gas production and mining activities.

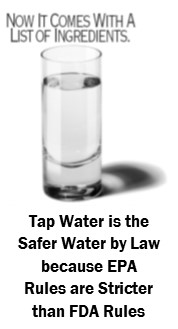
In order to ensure that tap water is safe to drink,

USEPA prescribes regulations which limit the amount of certain contaminants in water provided by public water systems.  FDA regulations establish limits for contaminants in bottled water which must provide the same protection for public health. Drinking water, including bottled water, may reasonably be expected to contain at least small amounts of some contaminants.  The presence of contaminants does not necessarily indicate that water poses a health risk.  More information about contaminants and potential health effects can be obtained by calling the Environmental Protection Agency=s Safe Drinking Water Hotline (1-800-426-4791).


Lead Tier 3 Reporting

If present, elevated levels of lead can cause serious health problems, especially for pregnant women and young children. Lead in drinking water is primarily from materials and components associated with service lines and home plumbing. Village of Ashville’s Water Department is responsible for providing high quality drinking water, but cannot control the variety of materials used in plumbing components. When your water has been sitting for several hours, you can minimize the potential for lead exposure by flushing your tap for 30 seconds to 2 minutes before using water for drinking or cooking.  If you are concerned about lead in your water, you may wish to have your water tested.  Information on lead in drinking water, testing methods, and steps you can take to minimize exposure is available from the Safe Drinking Water Hotline or at http://www.epa.gov/safewater/lead


Listed below is information on those contaminants that were found in the Village of Ashville’s Water Department:

11 hardness   12 iron

table one

table 2

table 3


About your drinking water

The EPA requires regular sampling to ensure drinking water safety.  The Ashville Water Department conducted sampling for {bacteria; inorganic; radiological; synthetic organic; volatile organic} during 2011.  Samples were collected for a total of four (4) different contaminants most of which were not detected in the Ashville Water Department water supply.  The Ohio EPA requires us to monitor for some contaminants less than once per year because the concentrations of these contaminants do not change frequently.  Some of our data, though accurate, are more than one year old.


Definitions of some terms contained within this report

  • Maximum Contaminant Level Goal (MCLG): The level of a contaminant in drinking water below which there is no known or expected risk to health. MCLGs allow for a margin of safety.
    Maximum Contaminant Level (MCL): The highest level of contaminant that is allowed in drinking water. MCLs are set as close to the MCLGs as feasible using the best available treatment technology.
  • Parts per Million (ppm) or Milligrams per Liter (mg/L) are units of measure for concentration of a contaminant. One ounce in 7,350 gallons of water. A part per million corresponds to one second in a little over 11.5 days.
  • Parts per Billion (ppb) or Micrograms per Liter (μg/L) are units of measure for concentration of a contaminant. One ounce in 7,350,000 gallons of water. A part per billion corresponds to one second in 31.7 years.
  • Action Level (AL): The concentration of a contaminant which, if exceeded, triggers treatment or other requirements which a water system must follow.
  • Action Level Goal (ALG): The level of contaminant in drinking water below which there is no known or expected risk to health. ALGs allow for a margin of safety.
  • Maximum Residual Disinfectant Level Goal (MRDLG): The level of drinking water disinfectant below which there is no known or expected risk to health. MRDLGs do not reflect the benefits of the use of disinfectants to control microbial contaminants.
  • Maximum Residual Disinfectant Level (MRDL): The highest level of a disinfectant allowed in drinking water. There is convincing evidence that addition of a disinfectant is necessary for control of microbial contaminants.
  • Million Fibers per Liter (MFL) millirems per year (mrem/year)pico Curies per liter is a measure of radioactivity = pCi/L.
    The “<“ symbol: A symbol which means less than. A result of <5 means that the lowest level that could be detected was 5 and the contaminant in that sample was not detected.


How do I participate in decisions concerning my drinking water?4 tower10 comunication

We want our valued customers to be informed about their water utility. If you want to learn more, please attend our regularly scheduled Village Council meetings. They are held at 6:30 P.M. on the first and third Monday of each month at 200 East Station Street.

For more information on your drinking water contact James Welsh or Franklin Christman 740 / 983 – 6367.

We are pleased to report that our drinking water is safe and meets federal and state requirements. This report shows your water quality and what it means. Drinking water, including bottled drinking water, may be reasonably expected to contain at least small amounts of some contaminants.  The presence of these contaminants does not necessarily indicate that water poses a health risk. Thank you for allowing us to continue providing your family with clean and quality drinking water this year.


Past Consumer Confidence Reports 


2 tank

Ohio Environmental Protect Division of Drinking & Ground Waters

July  2015 Village  of  Ashville  Water  Department Report

3 drinking water

Ashville annually reports on on the quality of water provided to our residents. The Ohio Environmental Protection Agency (O-EPA) calls this the CCR or Consumer Confidence Report. All community public water systems are required to prepare a CCR annually and distribute the report to their customers. The report contains information on the community’s drinking water including the source of the water, contaminants detected, the likely sources of detected contaminants, health effects of the contaminants when violations occur, and availability of source water assessments.

CCR’s are required by the 1996 amendments to the Safe Drinking Water Act. The Federal  Rule   (40  CFR  141.151 through 155) was finalized August 19, 1998. We hope this information will provide you comfort and security. We recognize that water quality is a very important area of operation.

The Village of Ashville pumped 234.696 million gallons in 2014 with 30.179 removed in the process resulting in total finished pumped  or  204.517 MG.

A Word from the Water Department

2014 has come and gone, but the changes made to our water treatment plant and system last year should carry us well into the future. The village invested last year by spending money on new flow metering, a new pump at well 4 site, a new emergency generator connection, and new communications at the water tower sites and water plant. Although costly these changes allow us more flexibility and control in how we process water and meet our increasing demand. Many meters were installed in the distribution system as part of our ongoing efforts to convert our entire metering system over to radio read. The backflow program was enforced and many inspections were done within our system, as we continue to help prevent cross contamination. We were fortunate last year to have very few interruptions of service and no major water breaks or problems either in the distribution system or plant. Most of the work listed before was scheduled and completed late at night to insure that there would be as little impact to our residents as possible. I would like to thank all of our contractors, staff, and village administration who coordinated together to complete these projects. Lastly we had no violations in 2014 and very few problems. For a water system that was built in 1935 we are blessed.

welsh

If you have questions or any problems concerning the water or the water system, please feel free to contact me.

Thank you for your time, Jim Welsh


Introduction


 6 intro

The Ashville Water Department is pleased to provide you with this year’s Consumer Confidence Report. We want to keep you informed about the excellent water and services we have delivered to you over the past year. Our goal is, and has been to provide you a safe and dependable supply of drinking water. The treatment facility is located at 140 Park Street. The water treatment facility removes iron and manganese by oxidation and filtration. The filtered water is softened using an ion-exchange process. The softened water is disinfected with chlorine prior to distribution to our customer. The Village of Ashville’s Water Department has prepared the following report to provide information to you, the consumer, on the quality of our drinking water.  Included within this report is general health information, water quality test results, how to participate in decisions concerning your drinking water and water system contacts.

We have been fortunate to have very few interruptions over the last year in our distribution system, such as large breaks resulting in loss of service.  Last year we also installed a new chorine feed system and overhauled our storage room.  New tanks, ventilation, and piping were installed with an outside bulk feed line.  These improvements make the delivery of chlorine significantly safer and more convenient.

Our water plant is turning 80-years old this year and,  although  improvements and additions have been made over the years, we continue to use the oldest part of the plant every day, notably without any violations or problems meeting demand.  Although 2013 brought some changes and challenges, we worked through them all together.    Over the last year I have taken a proactive role in improving customer service and relations, and will continue this effort in the years to come.

If you have any questions, do not hesitate to contact me.

Thank you for your time.


Source Water Information


7 water source

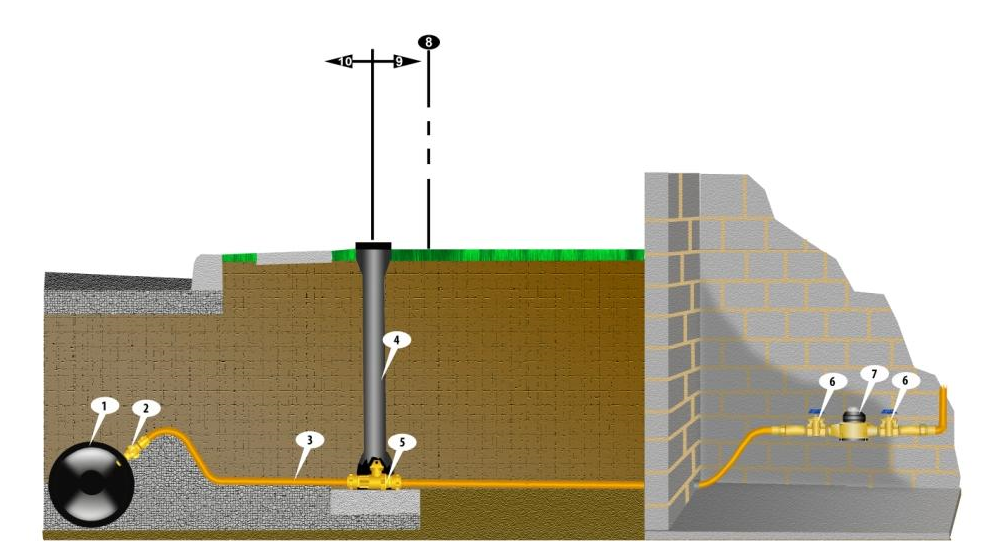
water service diagram snip

1. Water Main            2. Water Tap            3. Water Laterial            4 & 5. Curb Shut Off Valve            6, 7 & 8. Meter Set-up

 The SWAP can be found at http://wwwapp.epa.ohio.gov/gis/swpa/OH6500012.pdf 

The Village of Ashville’s Water Department receives its drinking water from two (2) wells located at the village-owned and operated facility. A third (3rd) well is located south of the village on Viking Way. These wells obtain raw water from the Teays Valley Aquifer.  Aquifers are porous underground formations (such as sand or gravel) that are saturated with water.


Source water informtion and how are these sources protected?5 epa standard for water

The Ohio Environmental Protection Agency has developed a program called Ohio's Source Water Assessment and Protection (SWAP) which is designed to protect our sources of drinking water. Through this program, the Ohio EPA has endorsed “the Delineation and Potential Contaminant Source Inventory components of the Village of Ashville’s drinking water source protection plan as meeting the requirements of the Ohio Wellhead Protection and Source Water Assessment and Protection Programs”.  According to this study, the aquifer (water-rich zone) that supplies water to the Village of Ashville has a high susceptibility to contamination.  This determination is based on the following:

  • presence of a relatively thin protective layer of clay/shale/other overlying the aquifer,
  • shallow depth (less than 50 feet below ground surface) of the uppermost aquifer, and
  • presence of significant potential contaminant sources in the protection area.

This susceptibility means that under currently existing conditions, the likelihood of the aquifer becoming contaminated is relatively high.  This likelihood can be minimized by implementing appropriate protective measures. More specifically this report identified seven (7) potential significant sources of contamination within the one year capture zones. They include: (1)sanitary sewer lines, (2,3,4) source wells, (5)natural gas line, (6) Ashville Park, and (7) municipal road maintenance. More information about the source water assessment or what consumers can do to help protect the aquifer is available by calling Tom Bouts, Jim Welsh, or Franklin Christman at 740-983-6367.


Special Precaution Needs8 special needs

Some people may be more vulnerable to contaminants in drinking water than the general population.  Immuno-compromised persons such as persons with cancer undergoing chemotherapy, persons who have undergone organ transplants, people with HIV/AIDS or other immune system disorders, some elderly, and infants can be particularly at risk from infection.  These people should seek advice about drinking water from their health care providers.  EPA/CDC guidelines on appropriate means to lessen the risk of infection by Cryptosporidium and other microbial contaminants are available from the Safe Drinking Water Hotline (1-800-426-4791).


What are sources of contamination to drinking water?

The sources of drinking water, both tap water and bottled water, include rivers, lakes, streams, ponds, reservoirs, springs, and wells.  As water travels over the surface of the land or through the ground, it dissolves naturally-occurring minerals and, in some cases, radioactive material, and can pick up substances resulting from the presence of animals or from human activity.

Contaminants that may be present in source water include: (A) Microbial contaminants, such as viruses and bacteria, which may come from sewage treatment plants, septic systems, agricultural livestock operations and wildlife; (B) Inorganic contaminants, such as salts and metals, which can be naturally-occurring or result from urban storm water runoff, industrial or domestic wastewater discharges, oil and gas production, mining, or farming; (C) Pesticides and herbicides, which may come from a variety of sources such as agriculture, urban storm water runoff, and residential uses; (D) Organic chemical contaminants, including synthetic and volatile organic chemicals, which are by-products of industrial processes and petroleum production, and can also come from gas stations, urban storm water runoff, and septic systems; (E) Radioactive contaminants, which can be naturally-occurring or be the result of oil and gas production and mining activities.

In order to ensure that tap water is safe to drink,

USEPA prescribes regulations which limit the amount of certain contaminants in water provided by public water systems.  FDA regulations establish limits for contaminants in bottled water which must provide the same protection for public health. Drinking water, including bottled water, may reasonably be expected to contain at least small amounts of some contaminants.  The presence of contaminants does not necessarily indicate that water poses a health risk.  More information about contaminants and potential health effects can be obtained by calling the Environmental Protection Agency's Safe Drinking Water Hotline (1-800-426-4791).


Lead and Tier 3 Reporting

If present, elevated levels of lead can cause serious health problems, especially for pregnant women and young children. Lead in drinking water is primarily from materials and components associated with service lines and home plumbing. Village of Ashville’s Water Department is responsible for providing high quality drinking water, but cannot control the variety of materials used in plumbing components. When your water has been sitting for several hours, you can minimize the potential for lead exposure by flushing your tap for 30 seconds to 2 minutes before using water for drinking or cooking.  If you are concerned about lead in your water, you may wish to have your water tested.  Information on lead in drinking water, testing methods, and steps you can take to minimize exposure is available from the Safe Drinking Water Hotline or at http://www.epa.gov/safewater/lead


Listed below is information on those contaminants that were found in the Village of Ashville’s Water Department:

  Mean Hardness 215 mg/L   


   Average Iron Content 0.33 mg/L   


OH6500012 ASHVILLE VILLAGE PWS        
Contaminants (Units) MCLG MCL Level Found Range of Detections Violation Sample Year Typical Source of Contaminants
Inorganic Contaminants
Chlorine Total (mg/L)  4 4 0.96 0.46-1.36 No 2011 Water Additive to Control Microbes.
Contaminants (Units) MCLG MCL 90th Percentile # of Samples over AL Violation Sample Year Typical Source of Contaminants
Copper (ppm) 1.3 AL=1.3 0.15 1 No 2012 Corrosion of Household Plumbing systems; Erosion of Natural deposits; Leaching from Wood Preservatives.
Lead (ppb)  0 AL=15 0.005 0 No 2012 Corrosion of Household Plumbing systems; Erosion of Natural deposits;
None of the samples exceeded the lead Action Level (AL) of 15 (ppb) or Copper Action Level at 1.3 (ppm)
TTHMs (ppb) [Total Trihalomethane]

No goal for

the total

80 2.00 NA No 2014 By-product of drinking water chlorination.
Barium (ppm) 2 2 0.0873 .087-.087 No 2013 Discharge of drilling wastes; Discharge from metal refineries; Erosion of natural deposits
Fluoride Total (ppm) 4 4 1.21 1.21-1.21 No 2013 Erosion of natural deposits; water additive which promotes strong teeth; discharge from fertilizer & aluminum factories.
Volatile Organic Contaminants MCLG MCL Level Found Range of Detections Violation Sample Year Typical Source of Contaminants
Chloroform (ppm) NA NA 0.00063 .00100-.00100 No 2014 By-product of drinking water chlorination.


OH6500012 ASHVILLE VILLAGE PWS          
Organic Disinfection Byproducts (DBPs) Collection Date Highest Level Detected Range of Levels Detected MCLG MCL Units Violation Likely Source of Contamination
Bromoform (tribromomethane) 2014 0.5 NA   80.0 ppb No Unregulated Contaminants
Bromodichloromethane 2014 0.0005 NA   80.0 ppb No Unregulated Contaminants
Dibromochloromethane 2014 0.0005 NA   80.0 ppb No Unregulated Contaminants
Detections of DBPs in raw water may be attributed to backflow of treated water, sampling from an incorrect location, or contamination in the source water. Consult the drinking water inspector in these situations
Monochloroacetic acid 2014 0.002 NA   60.0 ppb No Unregulated Contaminants
Trichloroacetic acid 2014 0.001 NA   60.0 ppb No Unregulated Contaminants
Monobromoacetic acid 2014 0.001 NA   60.0 ppb No Unregulated Contaminants
Dibromoacetic acid 2014 0.001 NA   60.0 ppb No Unregulated Contaminants
Five Haloacetic Acids (HAA5): the sum of the concentrations of Monochloroacetic acid, Dichloroacetic acid, Trichloroacetic acid, Monobromoacetic acid and Dibromoacetic acid


About your drinking water

The EPA requires regular sampling to ensure drinking water safety.  The Ashville Water Department conducted sampling for {bacteria; inorganic; radiological; synthetic organic; volatile organic} during 2014.  Samples were collected for a total of four (4) different contaminants most of which were not detected in the Ashville Water Department water supply.  The Ohio EPA requires us to monitor for some contaminants less than once per year because the concentrations of these contaminants do not change frequently.  Some of our data, though accurate, are more than one year old.


License to Operate (LTO) Information

We have a current unconditional license to operate our water system.

We 


Definitions of some terms contained within this report.

  • Maximum Contaminant Level Goal (MCLG): The level of a contaminant in drinking water below which there is no known or expected risk to health.  MCLGs allow for a margin of safety.
  • Maximum Contaminant Level (MCL): The highest level of contaminant that is allowed in drinking water.  MCLs are set as close to the MCLGs as feasible using the best available treatment technology.
  • Parts per Million (ppm)  or Milligrams per Liter (mg/L) are units of measure for concentration of a contaminant.  One ounce in 7,350 gallons of water. A part per million corresponds to one second in a little over 11.5 days.
  • Parts per Billion (ppb) or Micrograms per Liter (μg/L) are units of measure for concentration of a contaminant.  One ounce in 7,350,000 gallons of water. A part per billion corresponds to one second in 31.7 years.
  • Action Level (AL): The concentration of a contaminant which, if exceeded, triggers treatment or other requirements which a water system must follow.
  • Action Level Goal (ALG): The level of contaminant in drinking water below which there is no known or expected risk to health. ALGs allow for a margin of safety.
  • Maximum Residual Disinfectant Level Goal (MRDLG): The level of drinking water disinfectant below which there is no known or expected risk to health.  MRDLGs do not reflect the benefits of the use of disinfectants to control microbial contaminants.
  • Maximum Residual Disinfectant Level (MRDL): The highest level of a disinfectant allowed in drinking water.  There is convincing evidence that addition of a disinfectant is necessary for control of microbial contaminants.
  • Million Fibers per Liter (MFL) millirems per year (mrem/year)pico Curies per liter is a measure of radioactivity = pCi/L.
  • The “<“ symbol: A symbol which means less than.  A result of <5 means that the lowest level that could be detected was 5 and the contaminant in that sample was not detected.


How do I participate in decisions concerning my drinking water?4 tower10 comunication

We want our valued customers to be informed about their water utility. If you want to learn more, please attend our regularly scheduled Village Council meetings. They are held at 6:30 P.M. on the first and third Monday of each month at 200 East Station Street.

For more information on your drinking water contact James Welsh or Franklin Christman 740 / 983 – 6367.

We are pleased to report that our drinking water is safe and meets federal and state requirements. This report shows your water quality and what it means. Drinking water, including bottled drinking water, may be reasonably expected to contain at least small amounts of some contaminants.  The presence of these contaminants does not necessarily indicate that water poses a health risk. Thank you for allowing us to continue providing your family with clean and quality drinking water this year.

For more month to month and annual utility department information click on the the image to the right to access the Utility Department Report.

This is also available on the home page at the bottom, using the same image. 

utility logo 

For the Special Environmental Projects (SEP's) completed in 2014 click on the the image to the right to access that information.

This is also available on the home page within the slide show, using the same image. 

sep logo 

For the information about the Water Resources Recovery Facility (WRRF) click on the the image to the right to access that information.

This is also available on the home page within the slide show, using the same image. 

waste water logo 

Past Consumer Confidence Reports 


Ashville’s Public Water System Drinking Consumer Confidence Report (CCR)

Ohio Environmental Protect Division of Drinking & Ground Waters

Published Every July by the Village of Ashville Water Department

Annually, we include an annoucment about what the Ohio Environmental Protection Agency (O-EPA) calls the the CCR or Consumer Confidence Report in our newsletter. This report is on the quality of water provided to our residents. All community public water systems are required to prepare a CCR and distribute the report to their customers annually. The report contains information on the community’s drinking water, including the source of the water, contaminants detected, the likely sources of detected contaminants, health effects of the contaminants, and availability of source water assessments.

CCR’s are required by the 1996 amendments to the Safe Drinking Water Act. The Federal  Rule (40  CFR  141.151 through 155) was finalized August 19, 1998. We hope this information will provide you comfort and security. We recognize that water quality is a very important area of operation.

Listed below are the on-line reports by year, click on the title to go to that information:

We are pleased to report that our drinking water is safe and meets federal and state requirements. These reports show your water quality and what it means. Drinking water, including bottled drinking water, may be reasonably expected to contain at least small amounts of some contaminants.  The presence of these contaminants does not necessarily indicate that water poses a health risk. Thank you for allowing us to continue providing your family with clean and quality drinking water.

Past Consumer Confidence Reports

 2020 CCR published in June 2021   2016 CCR published in July 2017   2012 CCR published in July 2013
         
2019 CCR published in April 2020     2015 CCR published in July 2016   2011 CCR published in July 2012 
         
2018 CCR published in July 2019    2014 CCR published in July 2015    2010 CCR published in July 2011
         
2017 CCR published in July 2018    2013 CCR published in July 2014   2009 CCR published in July 2010

How do I participate in decisions concerning my drinking water?

We want our valued customers to be informed about their water utility. If you want to learn more, please attend our regularly scheduled Village Council meetings. They are held at 6:30 P.M. on the first and third Monday of each month at 200 East Station Street.

For more information on your drinking water contact James Welsh or Franklin Christman 740 / 983 – 6367.


 Facebook Logo roundeddownloadphone-png-clipart-phone-icon-clipart-best-clipart-best-image-949-800.png

Govt/Employee Login